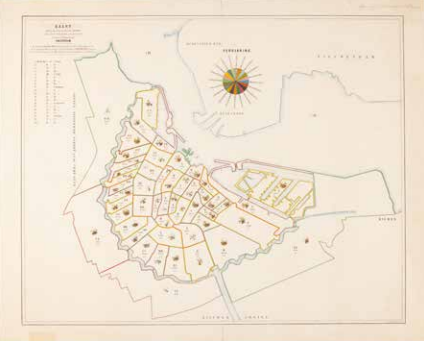
Cholera in Amsterdam
The Netherlands experienced its final significant cholera epidemic during the years 1866-67, with the disease spreading rapidly in Amsterdam. It was during this period that maps assumed a pivotal role in charting and discovering the patterns of transmission, heralding the advent of spatial epidemiology.
In 1854, in London, the scientist Dr. John Snow employs maps to decipher the pattern: He observes that a number of deaths were clustered around locations where contaminated cesspools were in proximity to shallow wells. Thirteen years later, Amsterdam employs statistical maps to investigate the spread patterns of cholera within the city.

J. Teixeira de Mattos, Map indicating the distribution of cholera and the number of deaths from this disease in each of the 50 districts of Amsterdam, Amsterdam (1867). Coll. S/T T.440, 67 x 83.5 cm.
