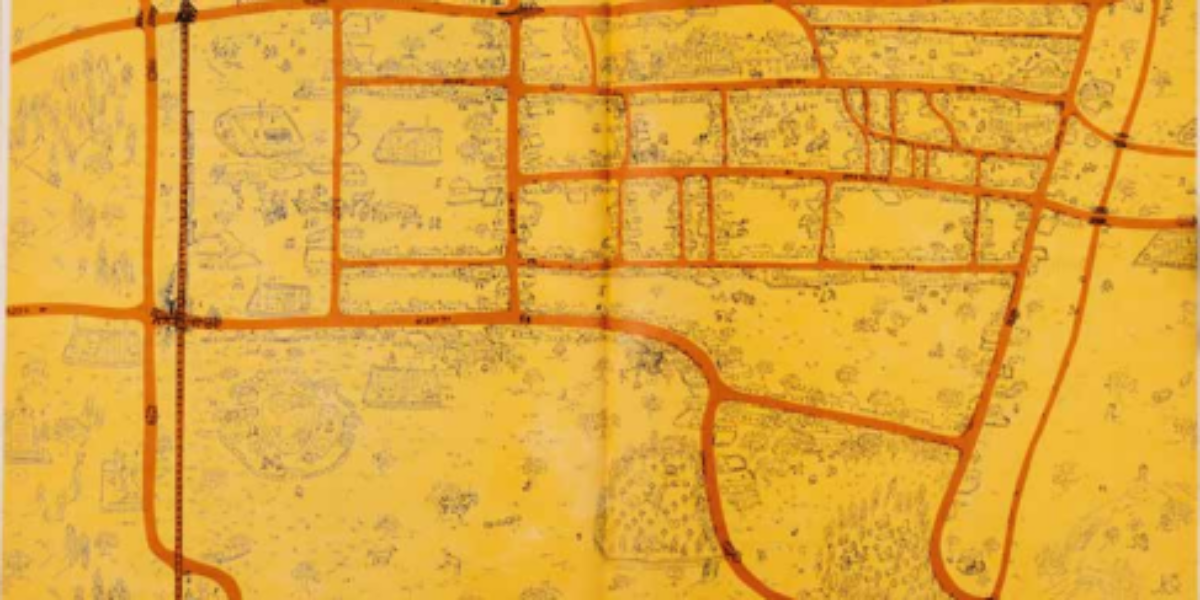
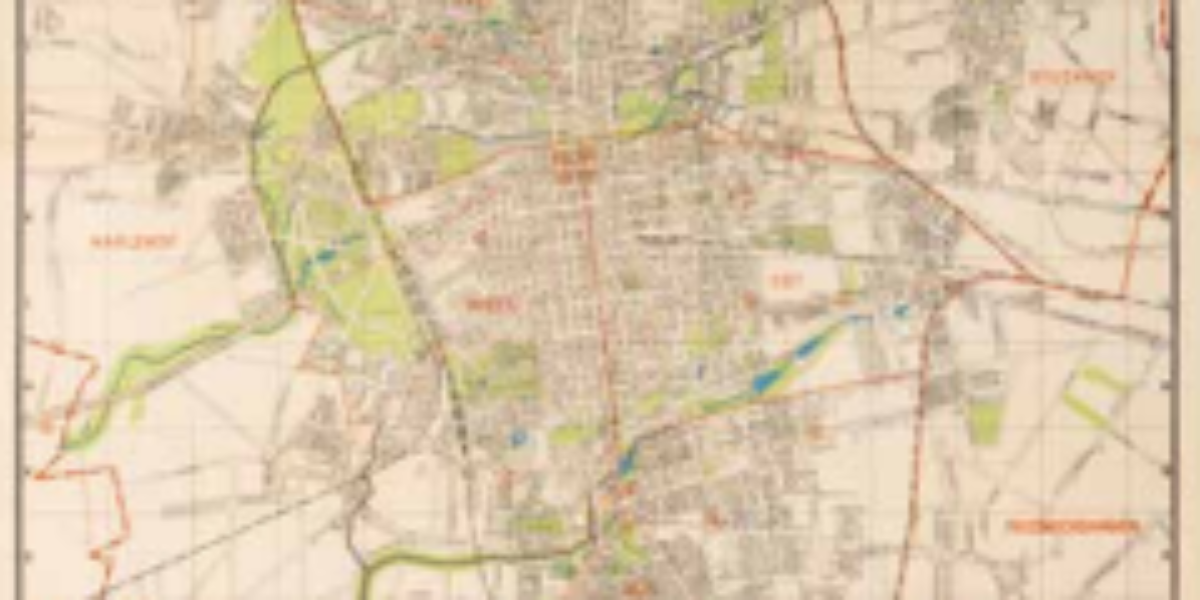
Each dot = ten Jews
In January 1941, Hans Böhmcker, ‘Beauftragter des Deutschen Reiches’ for Amsterdam, demands an inventory of the distribution of Jews throughout the city. Within ten days, twenty officials have prepared a first overview. After this, the municipality collects additional data on the Jews. In May 1941, 85,897 Jews were settled in Amsterdam, according to the population register. Black dots are manually placed) on the fifth edition of the map (1:10,000) of the Public Works Department from November 1941 (each dot = ten Jews. This ‘dot map’ shows how many Jews live in each neighbourhood in blue, and the number of gentiles in red. Together with twelve other maps, the dot map plays a key role in the debate about whether and how Amsterdam’s ‘Jewish neighbourhoods’ should be transformed into a ghetto. Despite half-hearted attempts to realise it, such a ghetto, didn’t appear in Amsterdam. However, 70,000 Amsterdam Jews were murdered by the Nazis, with the help of the excellent population administration.
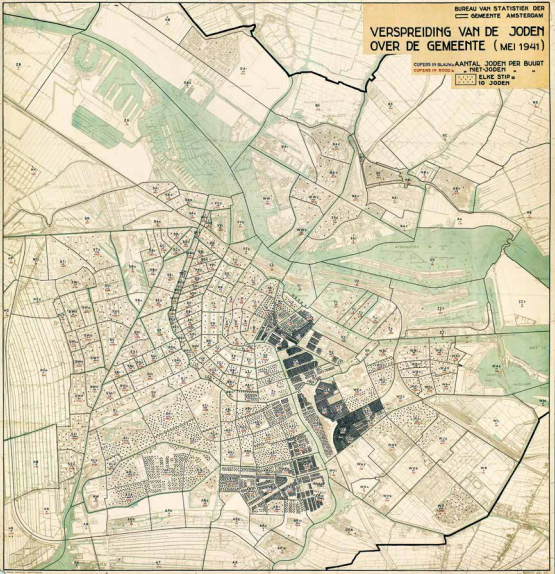
Bureau of Statistics of the Municipality of Amsterdam, Distribution of Jews throughout the municipality (May 1941), Amsterdam 1941. Digital print, Collection NIOD, 100 x 100 cm.
More chapters
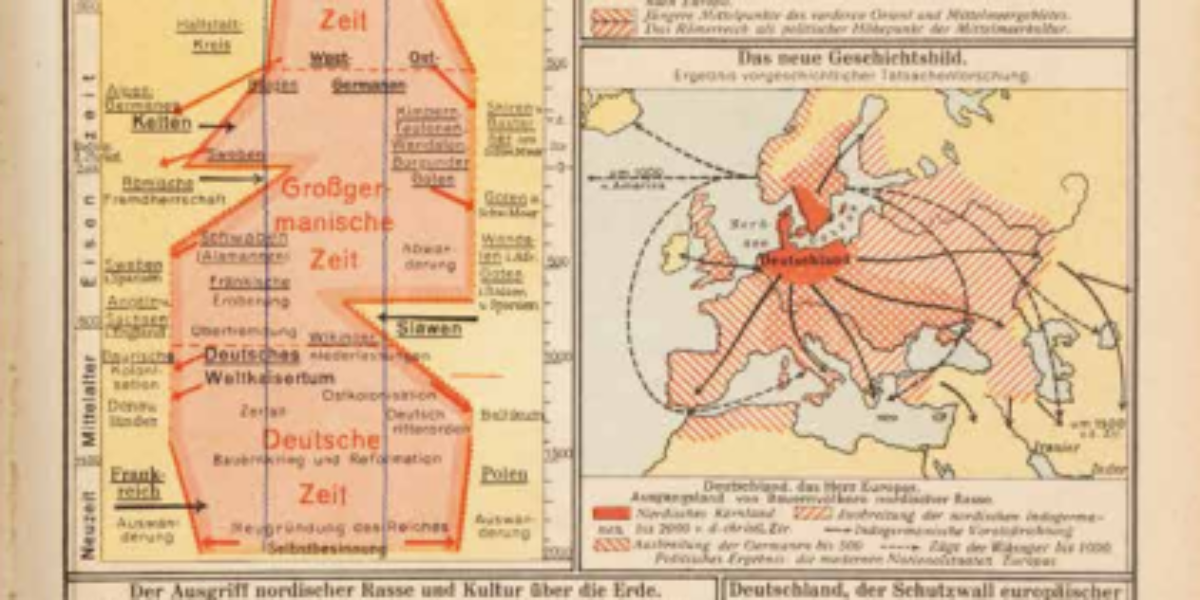
1. Deutsche Geschichtsbild
Germany cradle for Nordic race This school atlas marks a supplanting of the Nazi ideology of ‘thinking with the blood’ with ‘Bildung’ (humanist education). In the top right, the atlas outlines the paths through which urban culture ‘invaded’ northern Europe from the Middle East, via Greece and Rome. This map stands in contrast to the…
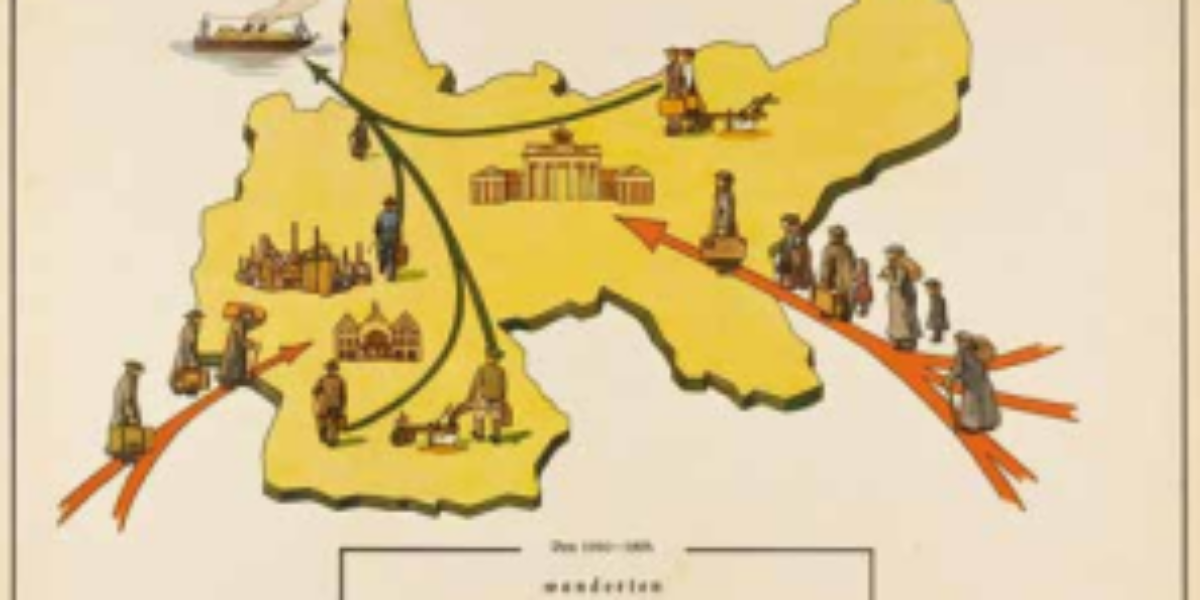
2. Gegenauslese
Gegenauslese – Population Starting in 1937, a set of 70 individual sheets were used in the curriculum of the upper classes at German folk schools in order to introduce students to the concepts of racial theory within the subjects of biology and heredity. This map draws attention to the threat of ‘repopulation.’ It illustrates the…
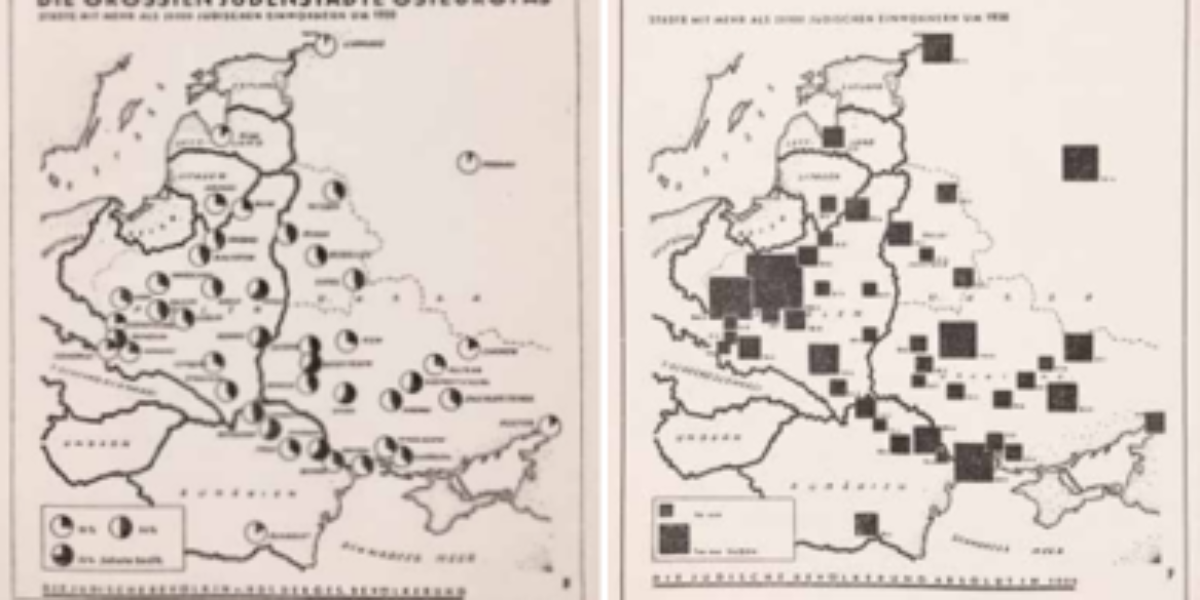
3. Judenstädte
Jewish cities and ghettos On the left side, one can observe population figures for the ‘Jewish cities’ of Eastern Europe expressed in absolute numbers, while on the right, these figures are expressed in percentages. This Nazi-made work on Jewry in Eastern Europe posits that within cities and ghettos, the growing Jewish population is gaining prominence…
4. Das alte Europa
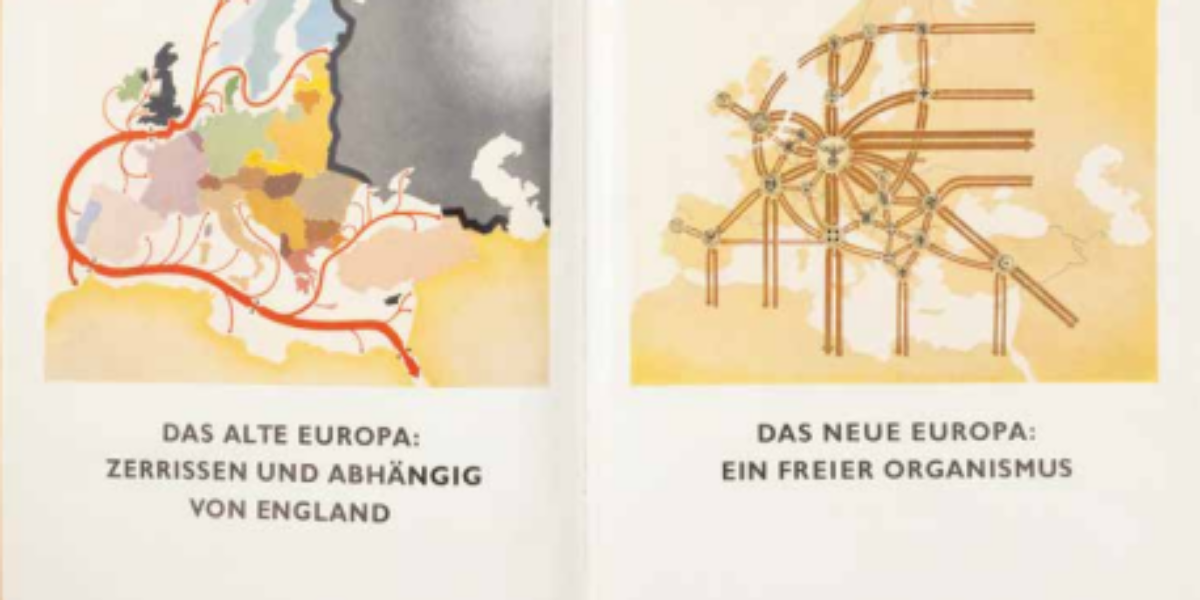
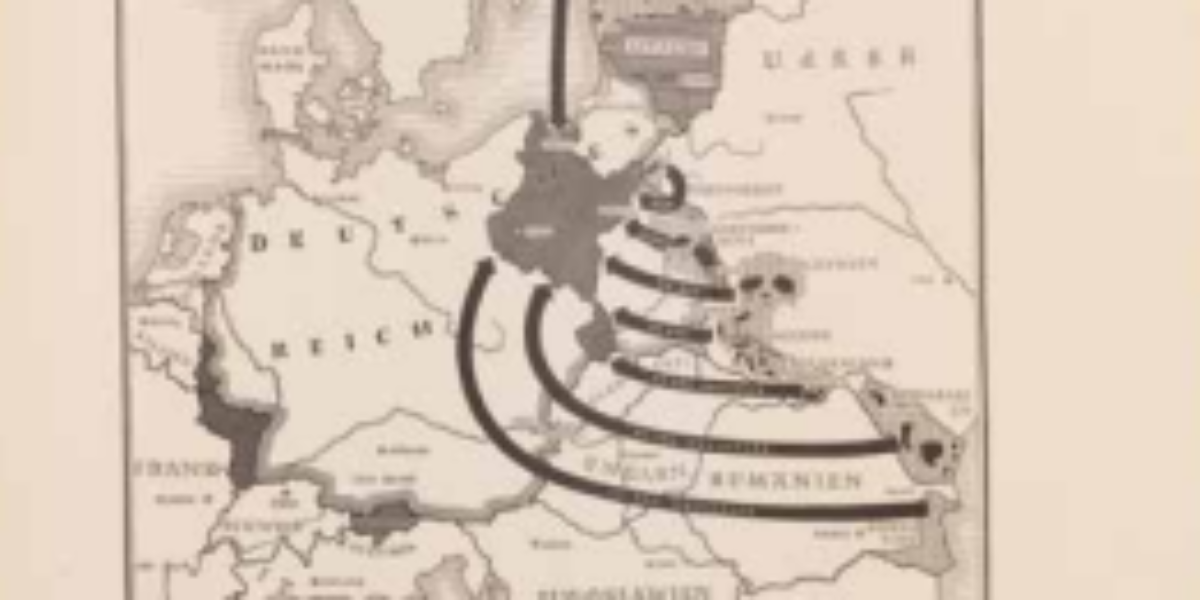
Old and new Europe These National Socialist maps were specially created for the ‘Autobahn und Wasserstrasse’ exhibition for Danube vassal states, organized by Reich Minister Todt (Armaments and Ammunition) in Budapest, Belgrade, Sofia, and Bucharest in 1942. On the left we see ‘Old Europe’, with its rivalling nation-states in a variety of colours. The British…
6. Lager Westerbork
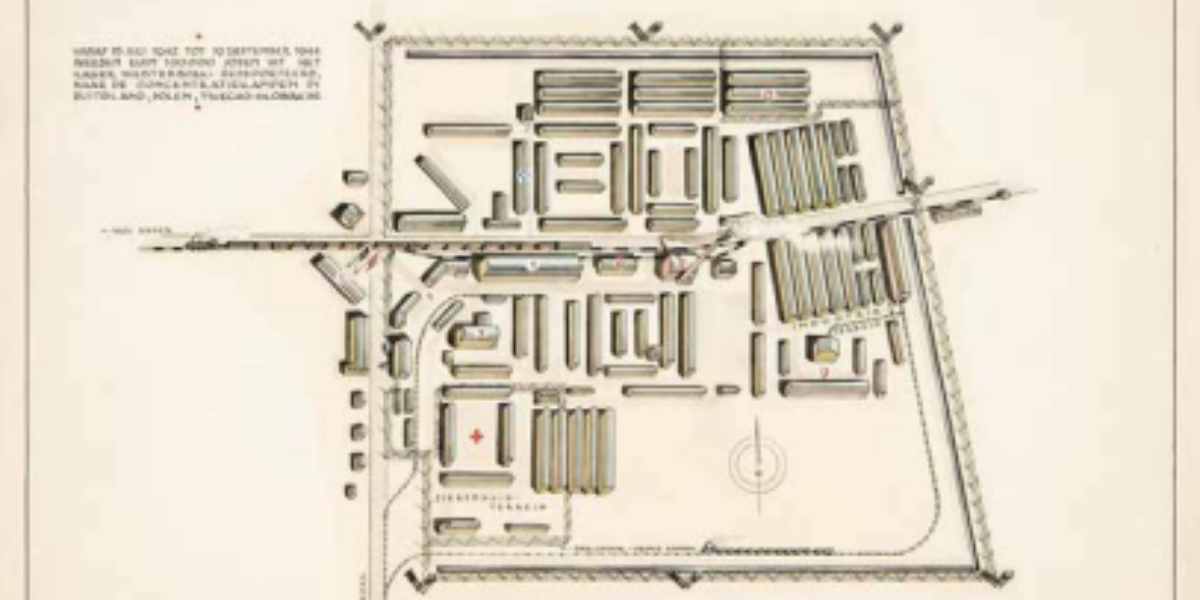
Westerbork transit camp Prior to the war, Westerbork in Drenthe served as a refugee camp for Jews, before being repurposed as a transit camp. Between 1942 and 1945, over 102,000 Jews, 245 Sinti, and dozens of resistance fighters were transported from here to the east. This map was made by Werner Löwenhardt, a German-Jew. His…
7. Verzeichnis der SF-Züge
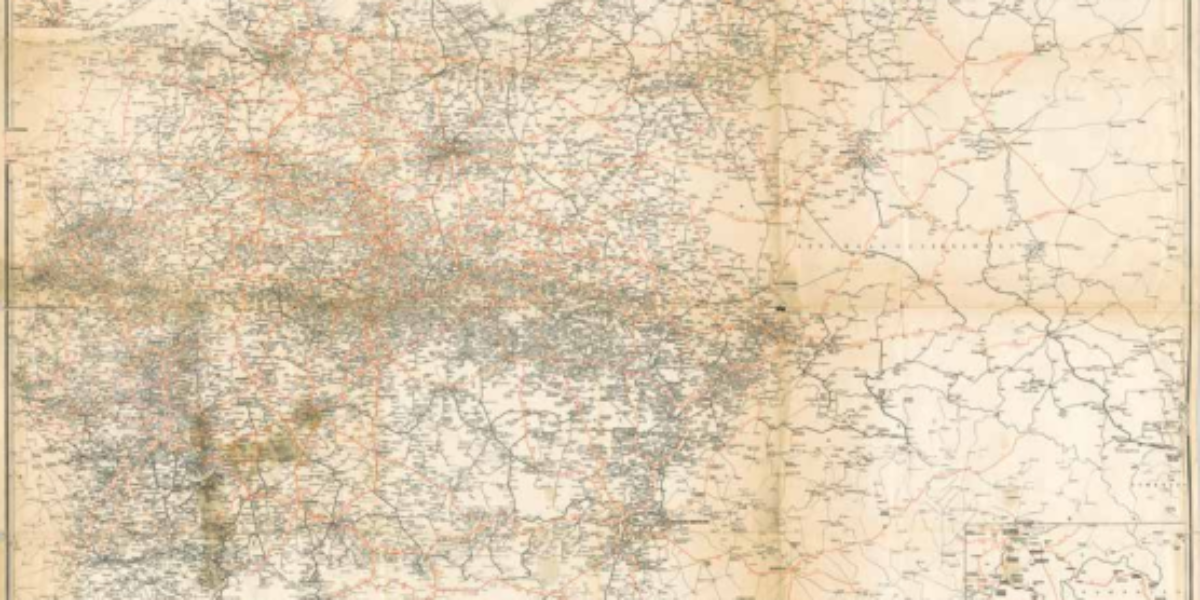
Trains to extermination camps Departing from Westerbork, 93 severely overcrowded trains depart for a secret ‘labor camp’ situated somewhere in the eastern region. Typically, these trains followed a path through Assen, Groningen, Nieuweschans, Bremen, Wittenberg, to Berlin-Spandau. From there, the transports continued through to Breslau, then to Czestochowa, ultimately turning south and ending at Auschwitz.
8. Lageplanskizze
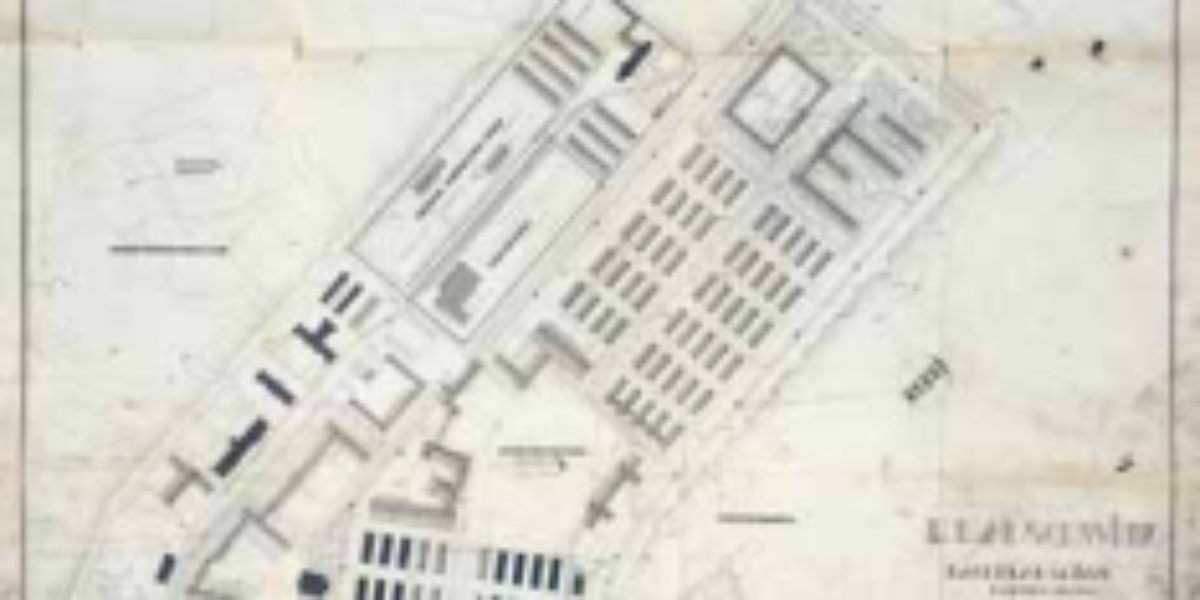
Auschwitz I expansion plan The Auschwitz concentration and extermination camp, established in 1940 as a single camp with 22 buildings, evolved into a vast complex with three main camps by the end of the war . This map, dating from April 1942, outlines the expansion plan for Auschwitz I, which includes a roll call area…
9. Jewish Quarter
Plan for a Jewish quarter Under orders from the occupying forces, the Nowa Kurier Warzawski publishes this plan on 15 October, 1940. All Jews residing outside this demarcated area were required to relocate to a newly established ghetto, situated around the old Jewish quarter, within a matter of weeks. This decree triggered disputes between ‘Jews…
10. Stadtplan Warschau
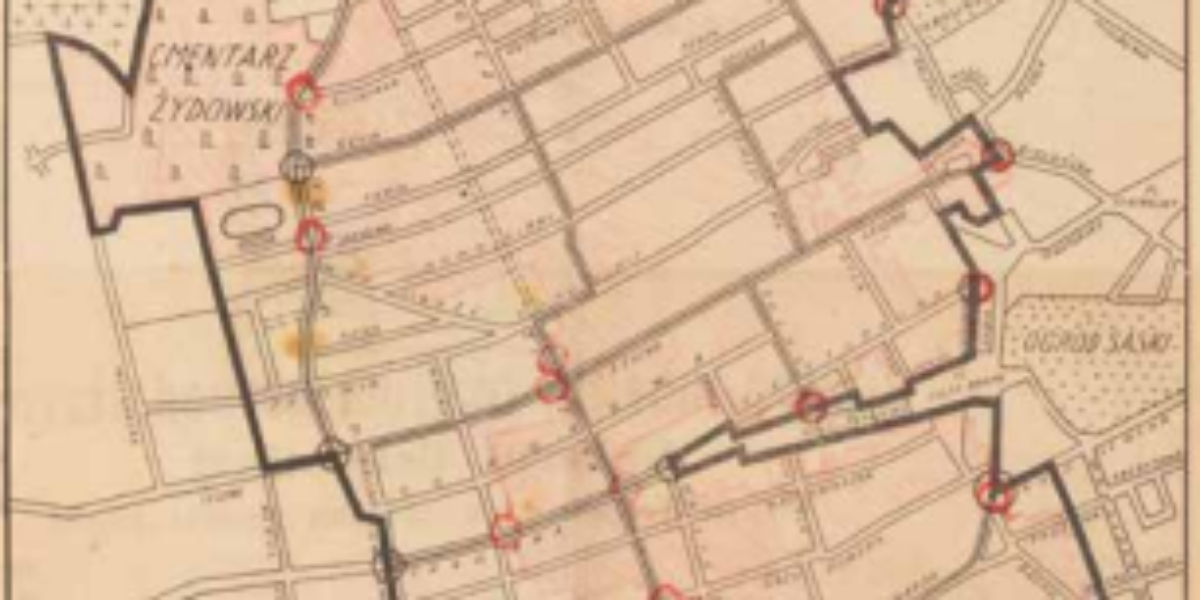
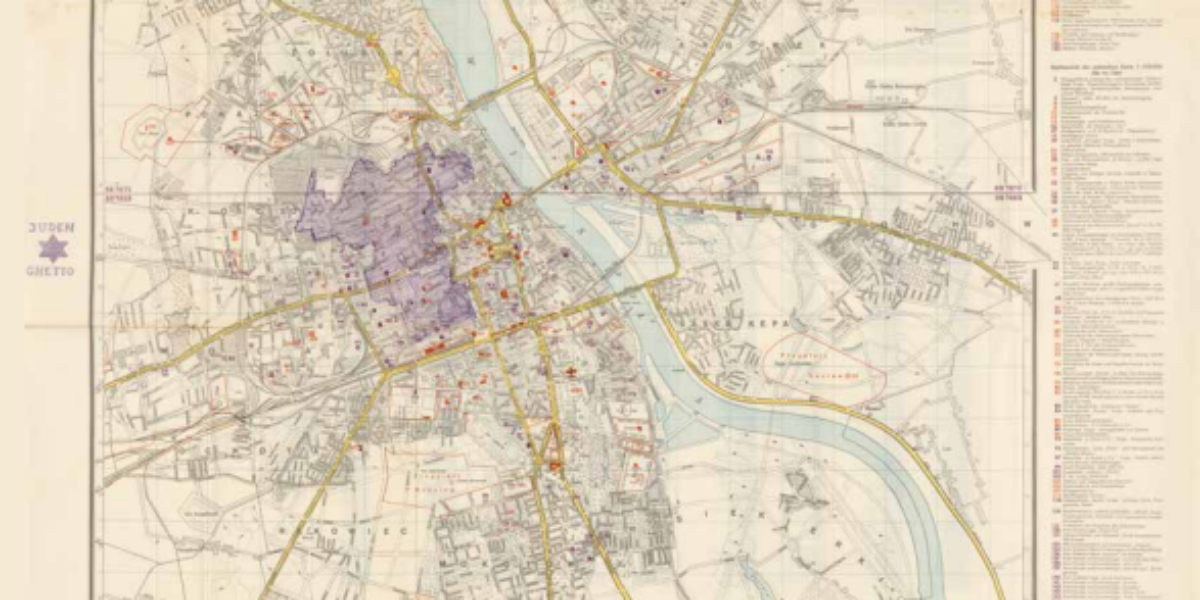
The Warsaw ghetto Around November 12, 1940, ‘SSSturmbannführer’ Max Jesuiter traces the area for a new Jewish ghetto on a secret military map of Warsaw, in purple pencil. The plan stems from an ordinance by the German governor, but the erratic borders result from quarrels between Jews and Poles over living space allocated to them….
11. Jüdischen Wohnbezirks
Walking routes to the ghetto in Lemberg This rare trilingual street poster, issued by the German governor on November 8, 1941, compels Jewish residents in Lemberg/Lwów/Lviv to settle in two slums located north of the railway line. The ghetto’s location was chosen by the newly appointed Ukrainian mayor. The poster includes mandatory dates and…
12. Beresteczko
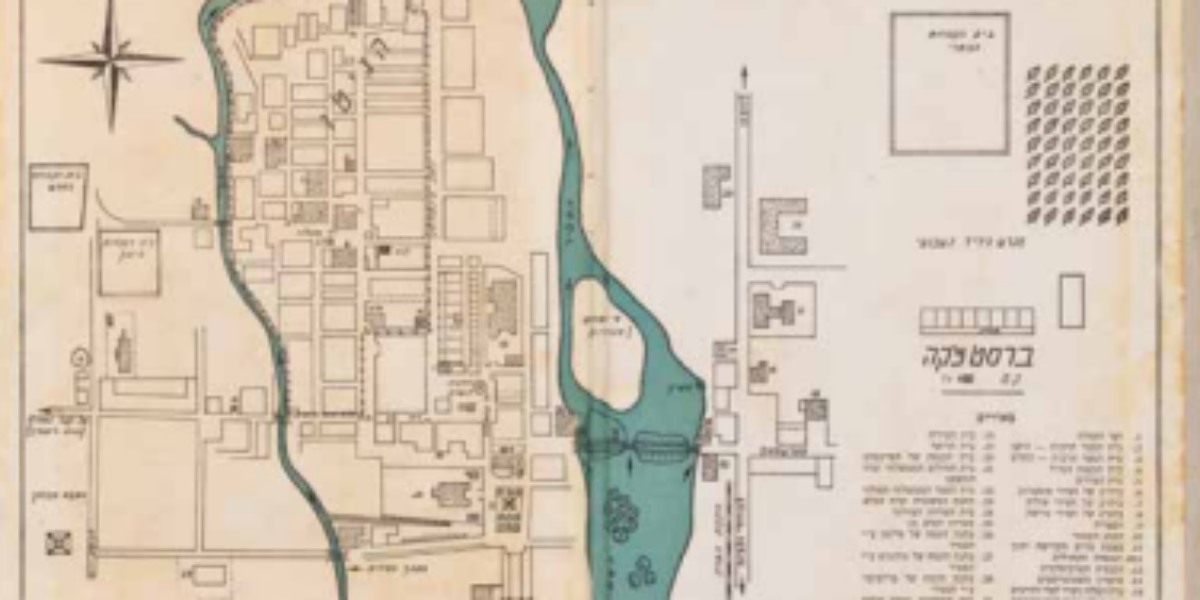
Ghetto cards in memorial books Beresteczko, situated in the Wolhynia district of what was once Poland (now Ukraine), was home to some 2,500 Jews, constituting roughly one-third of the population. In October 1941, the Germans established a ghetto in this area, as indicated by the barbed wire line on the map. Around September 8, 1942,…
13. Yanova
Mental maps of Shtetls In the absence of professionally-made maps, groups of survivors made new maps of their destroyed communities for their memorial books, known as ‘Jizker-bicher.’ These ‘mental maps’ didn’t adhere to topographical standards; rather, they served as testimonials to the world they had lost. For instance, in Yanova, where 80% of its 4,000-strong…
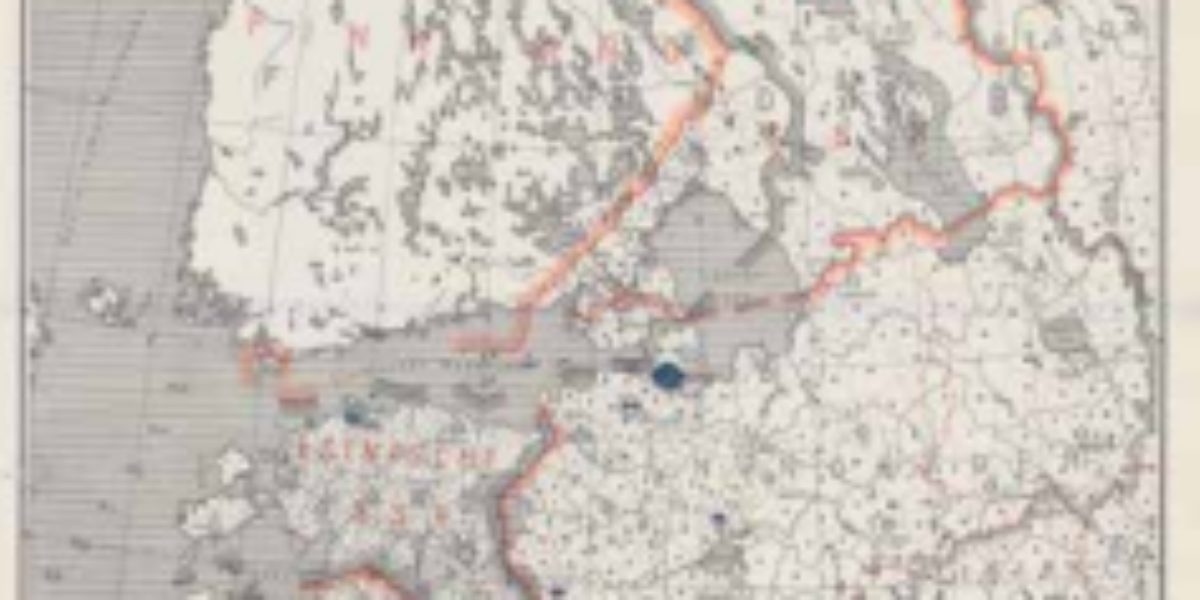
14. Europäischen Russland
Ethnic distribution Northwest Russia During the war years, the Nazis considered it indispensable to have precise information about the locations of pro-German ethnic minorities. On this map encompassing Lithuania and Poland, dots are used to indicate the main minority groups living within the territories of dominant ethnic groups. Borders from 1939 are in black, while…
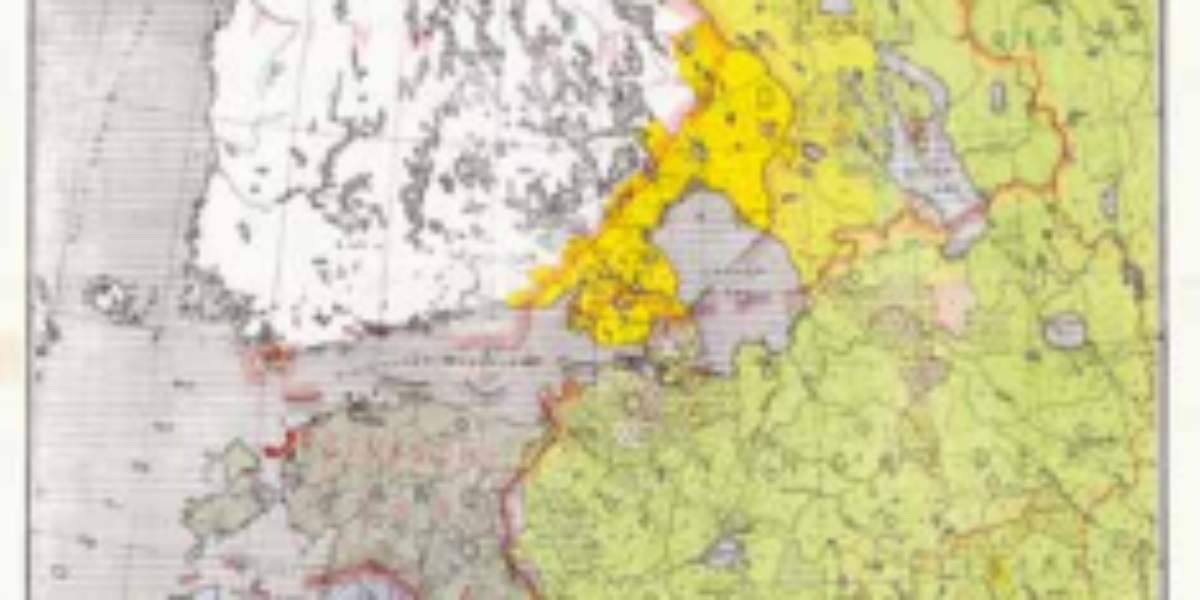
15. Verbreitung der Juden
Expansion of Jews in northwest Russia In this map, dot symbols ranging from less than 10 to 100,000 (represented by the Star of David), illustrate the numbers and distribution of Jewish populations. The map is a compilation of ethnic studies conducted well before June 1941. Such maps were used in preparations for the identification, segregation,…
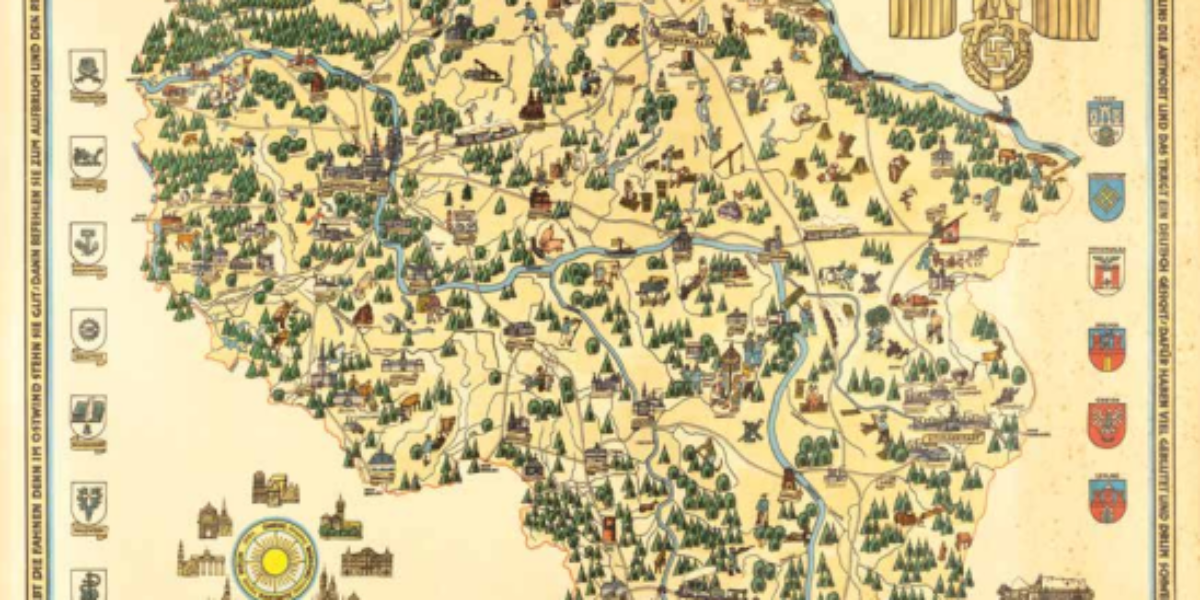
16. Reichsgau Wartheland
Warthegau as ‘blonde utopia‘ This map shows ‘the heart of the German East’ and serves as a compact representation of the Nazi ‘blood and soil’ ideology. The wall map portrays a landscape populated by farmers, forest workers, and artisans, featuring two major cities, Posen (Poznań) and Litzmannstadt (Łódź). A crucial issue with this envisioned ‘blonde…
17. Ost und West
Back home in the Empire Volksdeutsche are people who are considered Germans even though their families have lived in other countries for several generations, or even centuries. This 1941 map shows the forced relocation as agreed in the Hitler-Stalin Pakt. Approximately 426,700 Volksdeutsche, originating from the Romanian Dobroedja region to Estonia, were tasked with Germanising…
18. Plan von Litzmannstadt
Ghetto without street names The Nazis transformed Łódź into Litzmannstadt. This map, featuring German street names, omits the barbed wire boundaries of the ghetto. Nevertheless, the area of this first (and ultimately last) major ghetto remains easily identifiable. Streets within the ghetto are identified only by numbers and letters, implying that Jewish residents would tarnish…
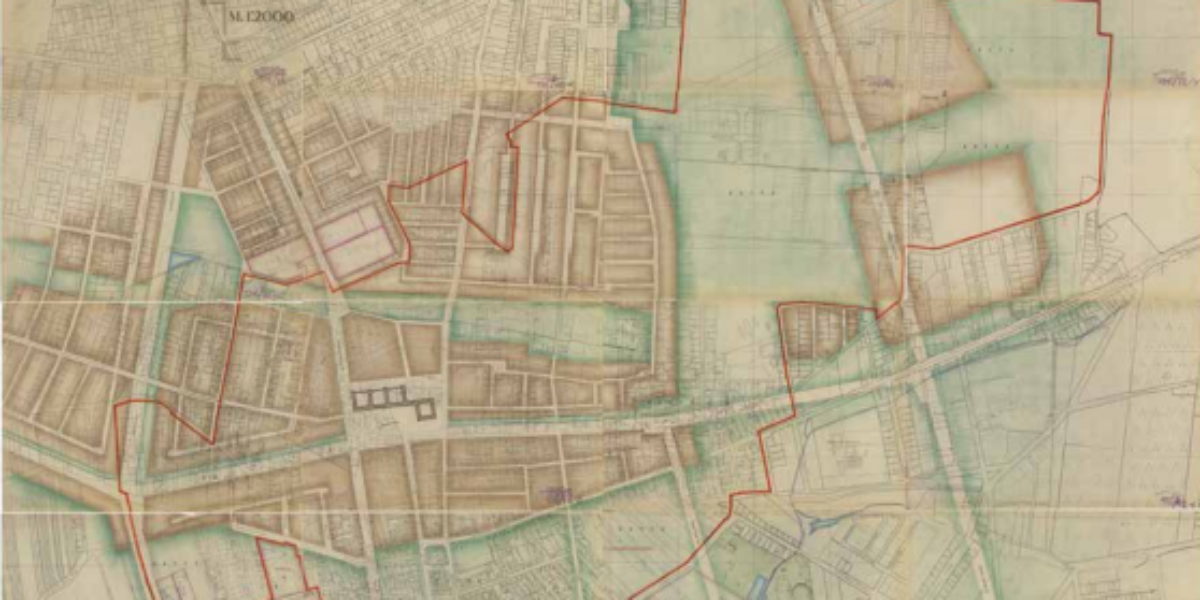
19. Litzmannstadt
Concrete utopia of German Lebensraum In January 1943, the urban planning department in Litzmannstadt designed a new city centre for the German population, featuring streets for parading and a roll call square. This was superimposed onto a cadastral map of the Jewish ghetto. Although it was limited in its implementation, this ‘concrete utopia’ of…
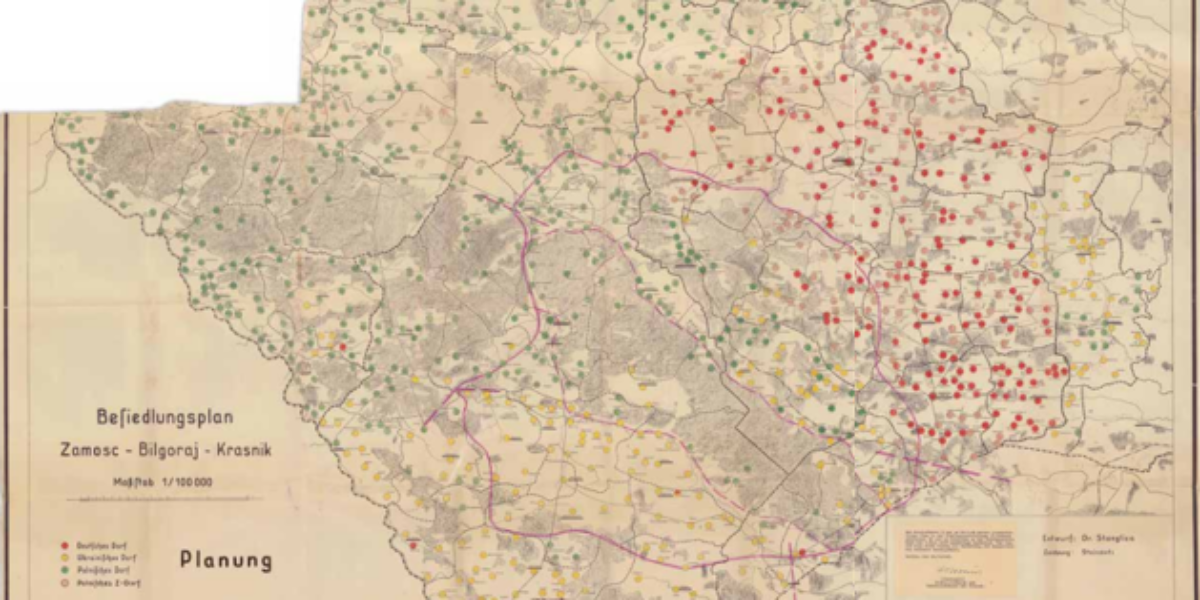
20. Besiedlungsplan
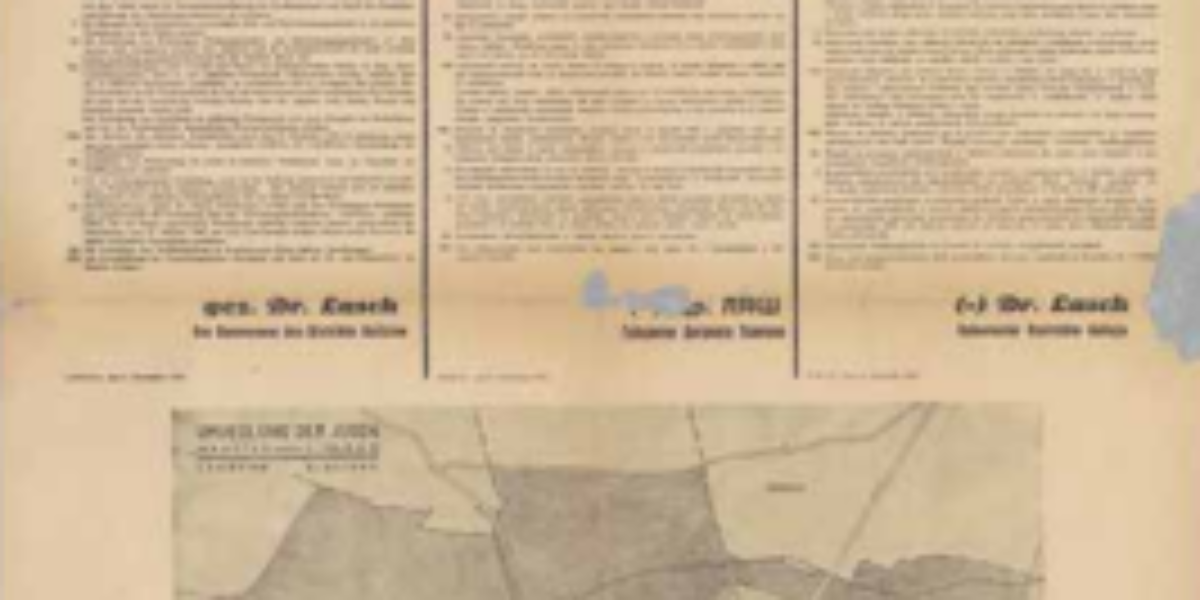
German peasant soldier colony Reichskommissar Himmler puts SS and Polizeiführer Globocnik of Lublin District in charge of the Germanic colonization project in the region around Zamosc, currently in south-eastern Poland. After the Jews had been deported, some 110,000 Poles and Ukrainians in 294 villages are arrested and racially selected between November 1942 and August 1943….
21. Treblinka
Localising the unimaginable When this map found its way to New York, Treblinka II was in the process of being dismantled following an uprising. The origin of this image can be traced back to a manuscript card from Warsaw, dating from late 1942. Within the confines of the ghetto, Rachel Auerbach documented the account of…
22. Western Belarus
Jewish partisans In West Belarus and Wolhynia (northwest Ukraine), Jewish resistance fighters regularly allied with anti-fascist partisans who operated in the region’s forests and swamps. An underground Jewish bunker community emerged, housing over a thousand men, women, children, and elderly individuals. This clandestine settlement featured essential facilities such as a field hospital, prison, school, and…
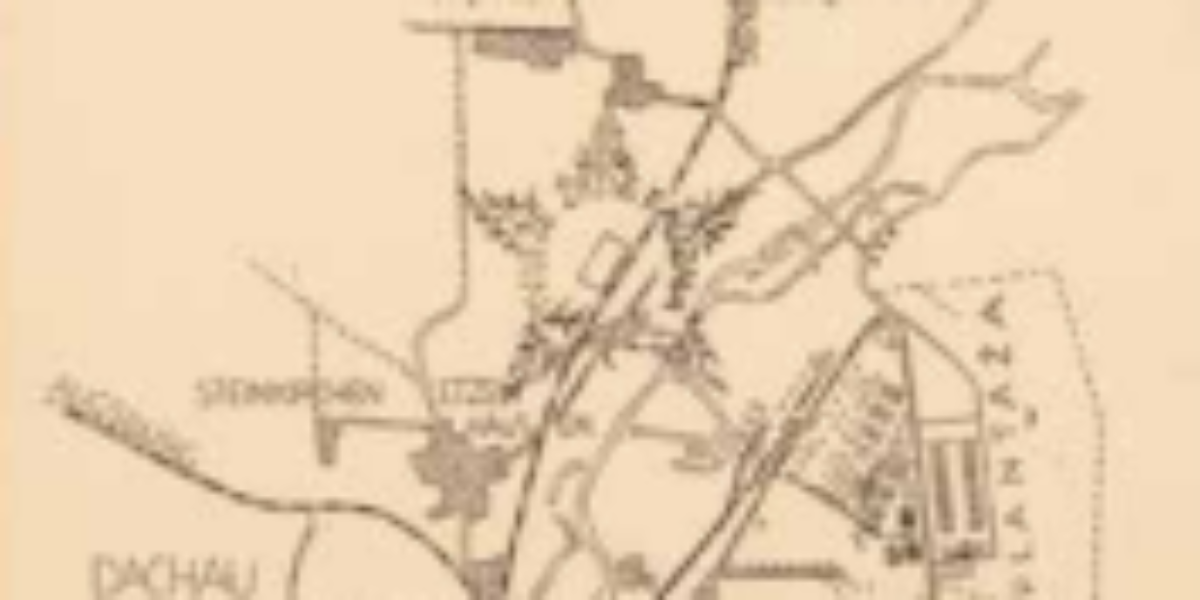
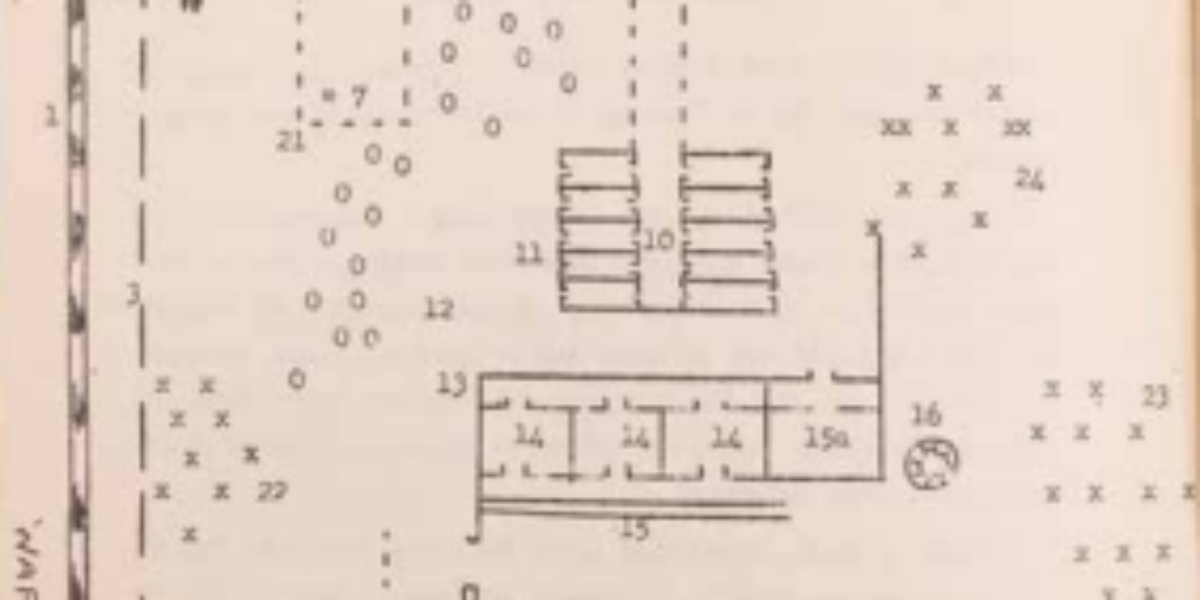
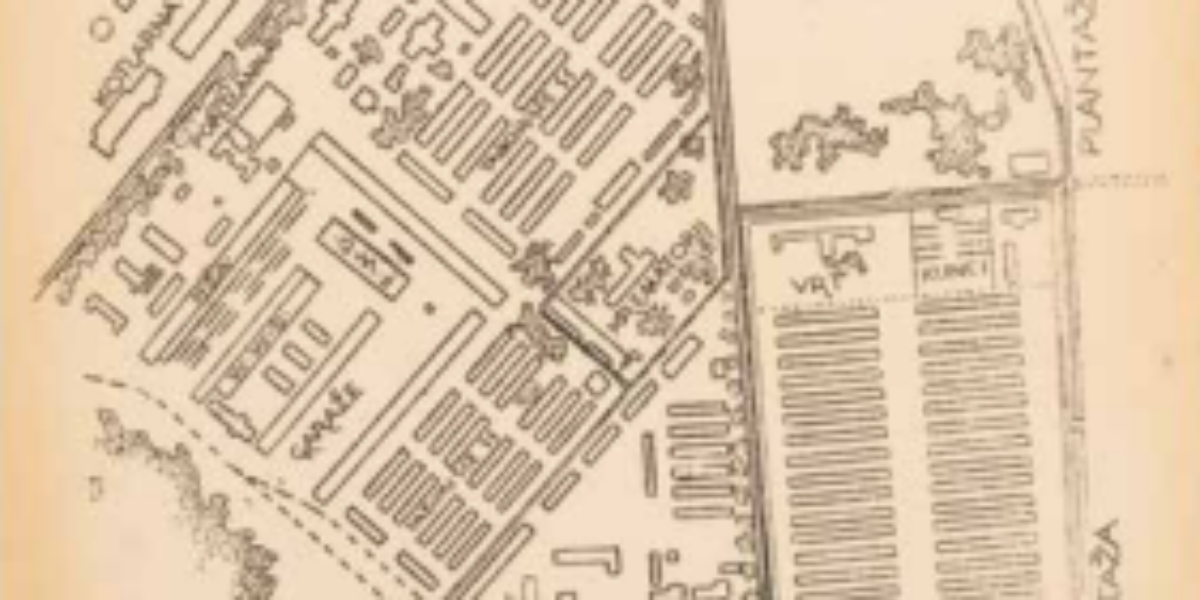
23. Dachau concentration camp
Dachau: camp and city after liberation These maps of the oldest SS concentration camp Dachau and a nearby mass grave were made at the camp by Marko Zupančič. He published these maps in the “first and hopefully last newsletter” by and for Slovenian partisans on June 1, 1945. This publication came a month after the…