Design prize 2025
Design Museum Den Bosch is proud to present the work of three talents from the Brabant design world, selected by Niels van Eijk and Miriam van der Lubbe, winners of the Design Prize for 2025.
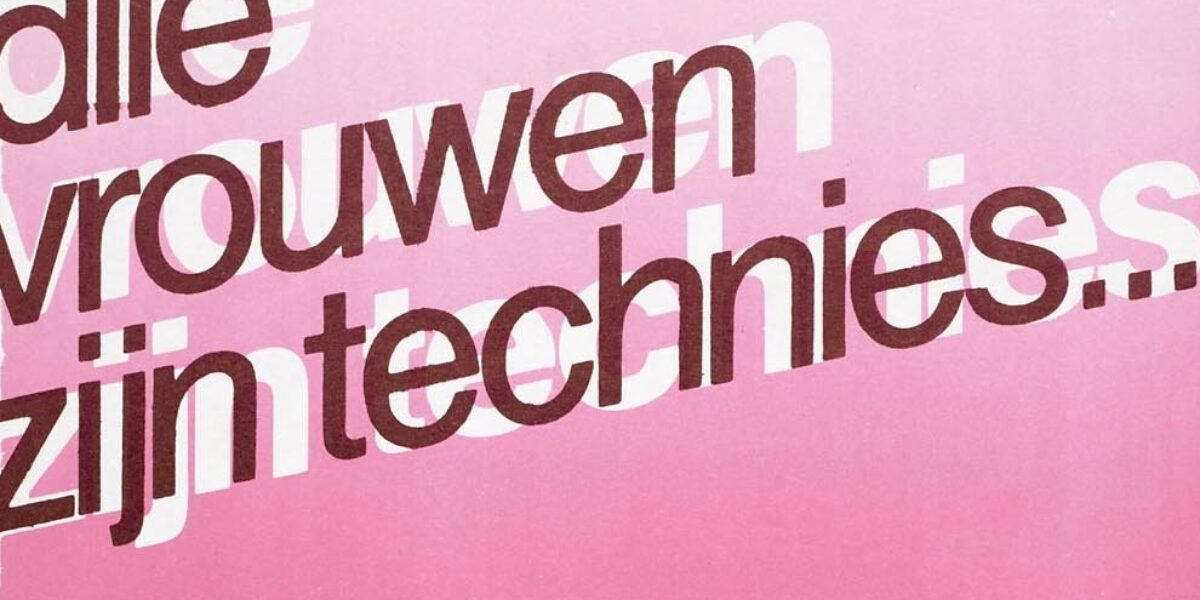
The exhibition “Women as technology” features a timeline on women’s emancipation in the Netherlands. In this article, you will find a more detailed explanation of this timeline.
The exhibition ‘Women as technology’ features a timeline on laws and regulations in the Netherlands. In this article, you will find a more detailed explanation of this timeline.
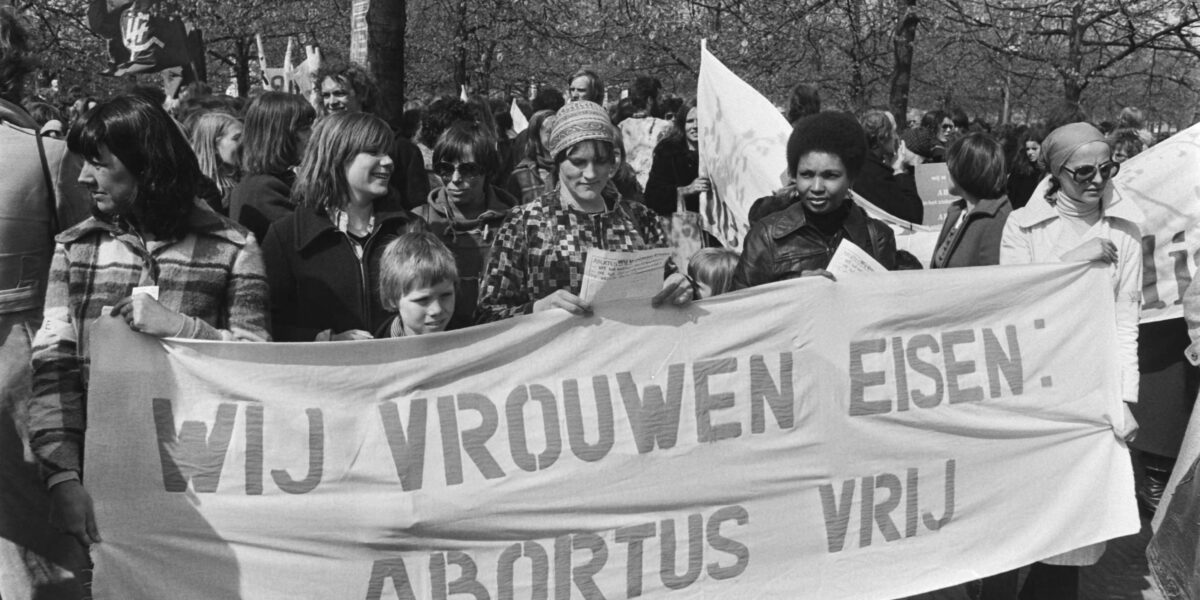
The womb might well be the most discussed and regulated female organ in history. Not as part of the body, however, but as an abstract, reproductive object.

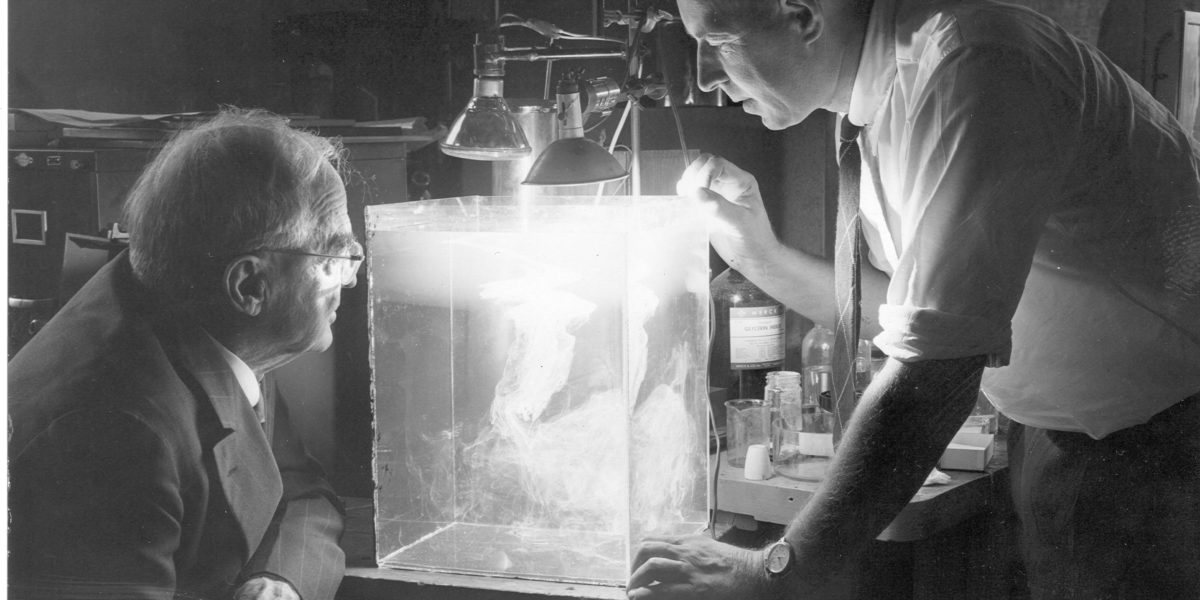
Before ‘computers’ were machines, the word was used to describe women who performed complex calculations. Their work was indispensable, but was undervalued in terms of both status and pay.

Although domestic technology is seemingly designed to reduce work, it has mostly served to heighten the existing division of roles within the home.

Rather than being futuristic fantasies, hyperfeminine robots in movies and comic books reflect deeply rooted gender stereotypes. Their design is rarely neutral: they are slender, sensual and obedient – tailored to the male gaze.

On Friday 20 June, it’s Museum Night again! Het Noordbrabants Museum and Design Museum Den Bosch open their doors for free from 19.00 to 22.00. Everyone is welcome for an evening filled with music, performances, workshops, tours, DJs, and more.
From art academy to museum
The ceramics cabinet on the museum’s second floor is showing a selection of ceramics collected by Jan van Haaren. You will find work here by Dutch ceramists such as Etie van Rees and Jan van der Vaart, but also big European names like Lucie Rie and Lucio Fontana.
From Bauhaus to Mecca
From Bauhaus to Mecca focuses on the life’s work of Dr Mahmoud Bodo Rasch. His work gives the opportunity to investigate the modern world of design and architecture. You can discover how the enormous social phenomenoms as the Islamitic pilgrimage the Hajj is connected with design.

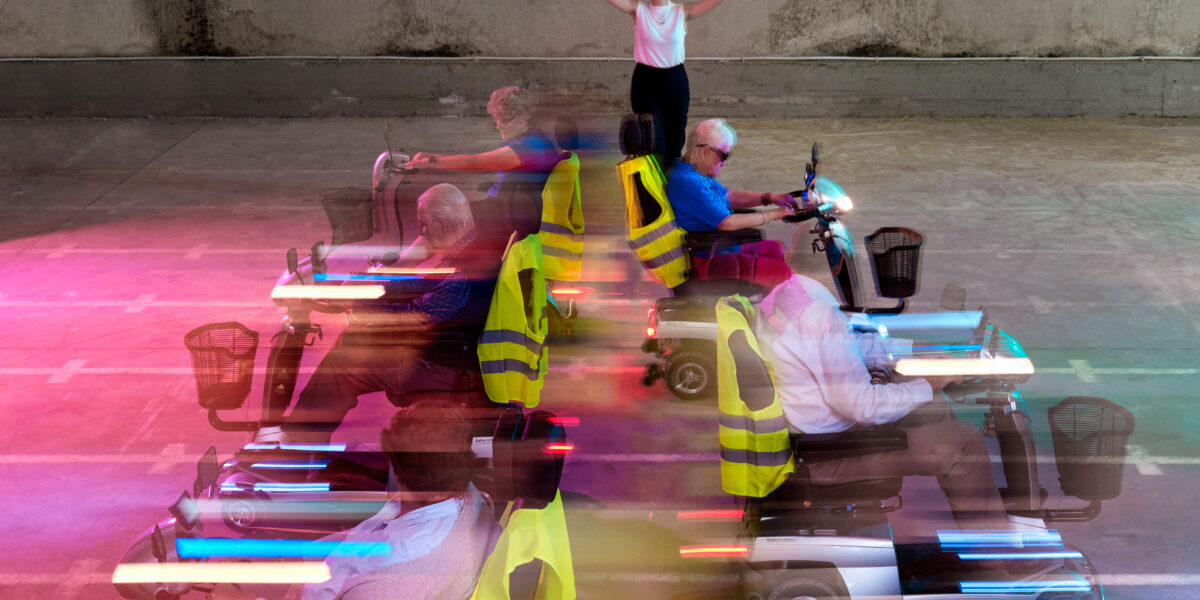
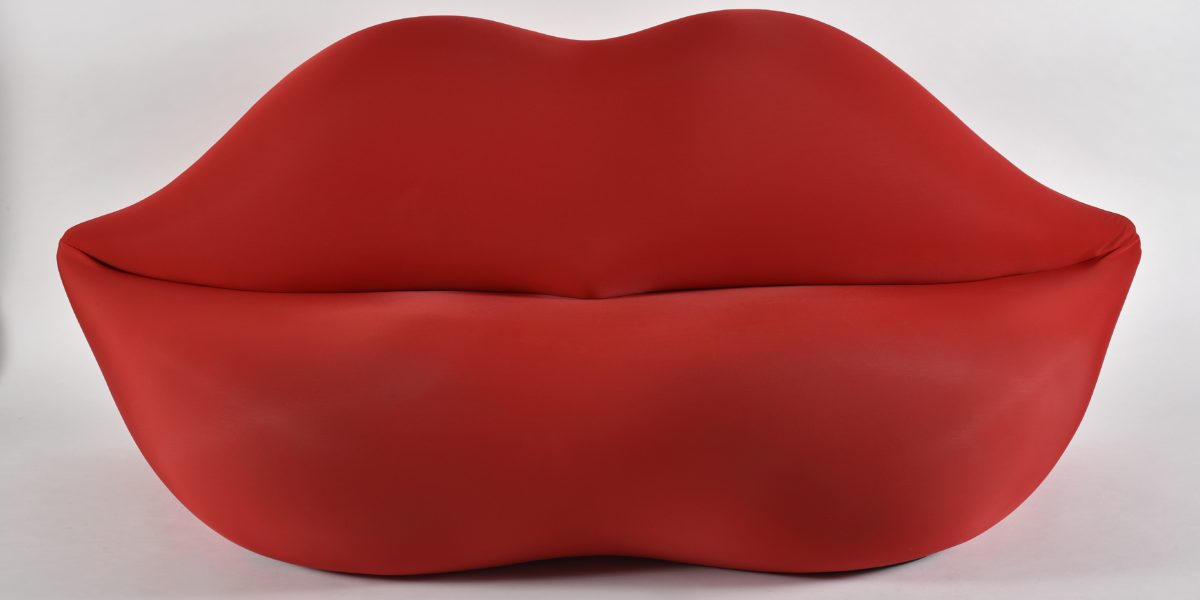
Women as technology
Why is it that virtual assistants like Siri, Alexa and Cortana often have a female-sounding name and voice? Why was it that in the 1940s the calculating power of computers was expressed in ‘girl hours’? Discover it in the exhibition Women as technology.
All the time in the world
How do we measure time? And above all, how do we shape it? What do ‘being productive’ and ‘getting the maximum out of your day’ actually mean? All the time in the world pauses time for a moment so we can take a closer look at it.
Soft Spaces: Beyond the glitter
The presentation is the result of a unique co-creation process in which groups from the city have teamed up with textile artists to develop a ‘soft space’ together. For this second round of Soft Spaces, the Drag Up Family worked with the textile artist Yamuna Forzani. The result is an artistic living room in which you will discover the local drag collective’s experiences.

Trans Europa Design Express – a journey through five design collections
This exhibition offers a thrilling tour of five major European design collections. The choices vary widely, reflecting the history of these high-profile institutions.
Soft Spaces: Dug-out
For the past three months, eleven young people drawn from the network of the youth support organization PowerUp073 have been working on a Soft Space of their own with the fashion designer Baby Reni.

Supreme – Resampling the World
For many young people, it’s a well-known and coveted logo: the white letters on a bright red surface of the skate brand Supreme. For older generations, the Supreme universe of drops, camping, resellers, hypebeasts, logomania, and collaborations is a completely unknown world. Design Museum Den Bosch now presents the first museum exhibition of the Supreme brand
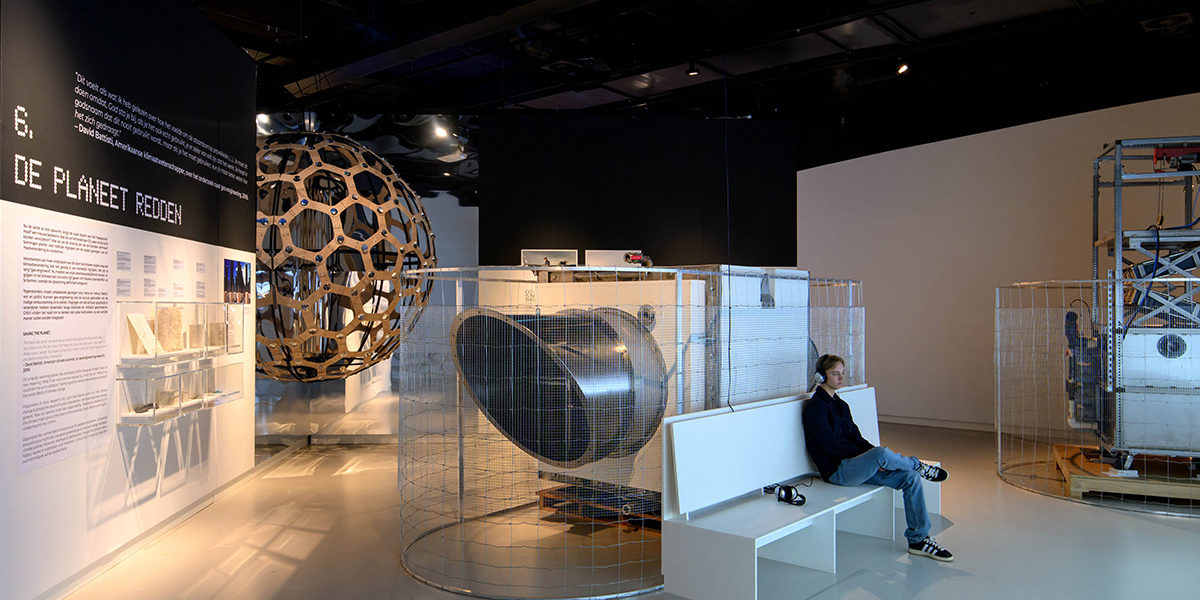
Design for the planet
Designers, architects and engineers have dreamed for centuries of shaping our world. What if we could build entire continents, tame hurricanes, or dim the sun’s radiation? This kind of large-scale, deliberate intervention in nature is also referred to as ‘geoengineering’: the alteration, construction and design of the earth itself. The design and history of the…
Changes affecting the whole planet require a global vision of cooperation, justice and responsibility. Can humanity design such a world?

On a rapidly warming planet, the old dream of the ‘designer climate’ takes on new meaning. What if we could remove excess CO2 from the air? What if we could dim the sun’s radiation?
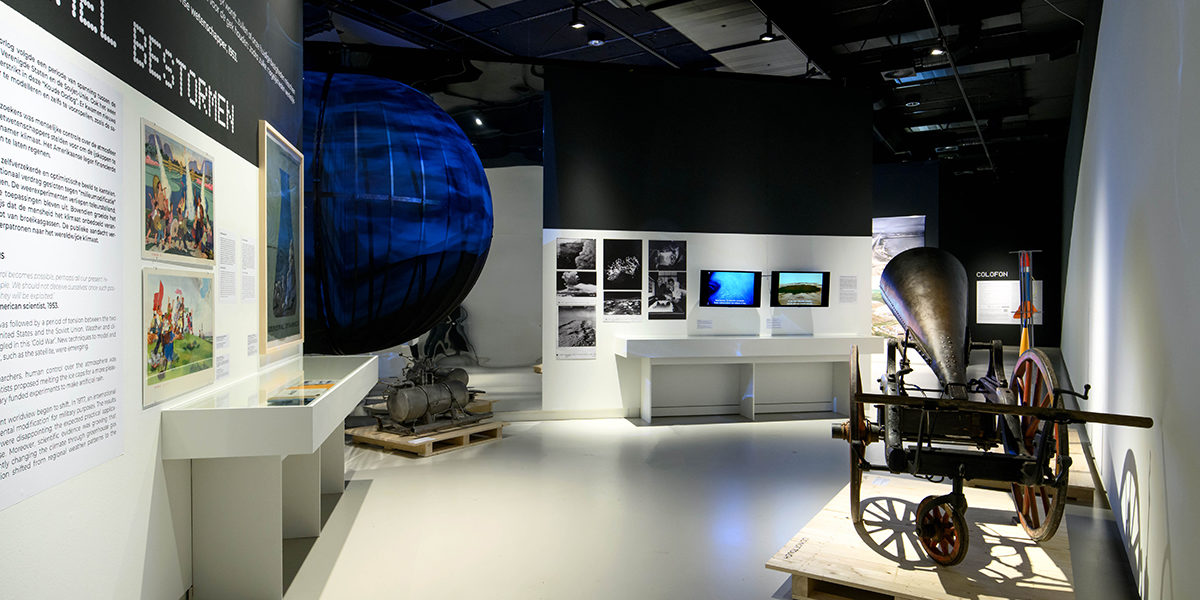
Mad scientists, space lasers, mysterious satellites… our imagination is often more powerful than technological reality.
The Second World War was followed by a period of tension between the two new superpowers, the United States and the Soviet Union. Weather and climate also became entangled in this ‘Cold War’. According to some researchers, human control over the atmosphere was within reach.
From 1850, newly discovered evidence of a prehistoric ice age in Europe led to a widespread debate about the potential causes of climate change. These discussions reinforced the idea that human activities could change the climate. A rock-solid belief in the power of technological progress became widespread.
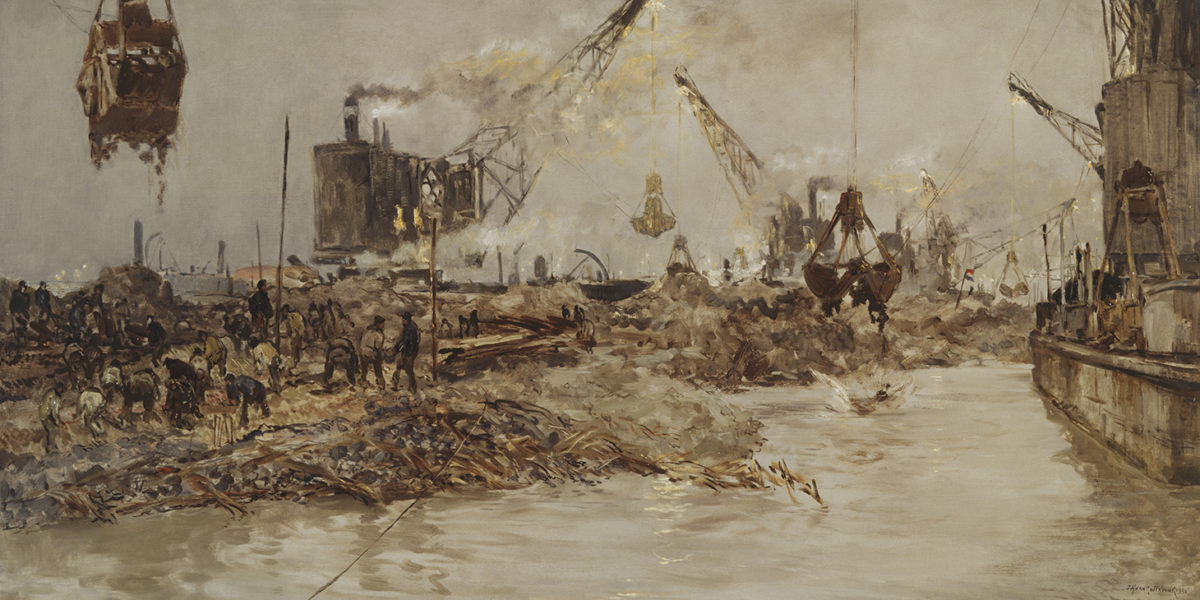
People and their environments have been influencing each other for thousands of years. To this day, specific designs and products are used to ‘tame’ nature and make it profitable.
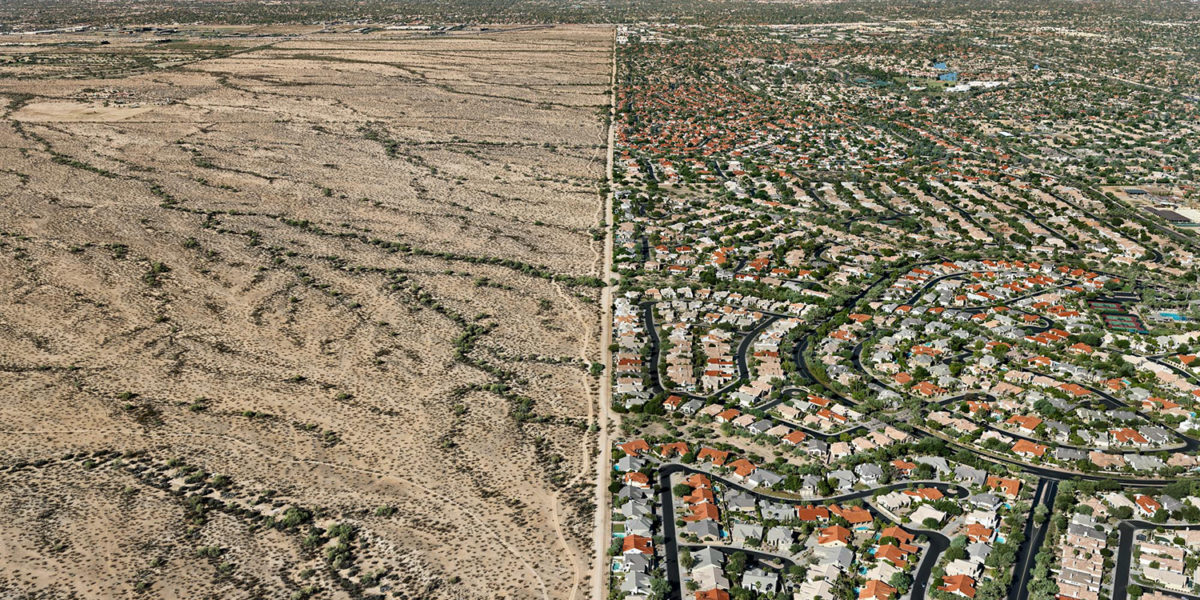
For a long time, the effects of human actions on nature were mainly observed on a local scale. From the 20th century onwards, the image of climate as a global and complex system gained immense influence – partly thanks to increased globalisation and the emergence of modern climate science.

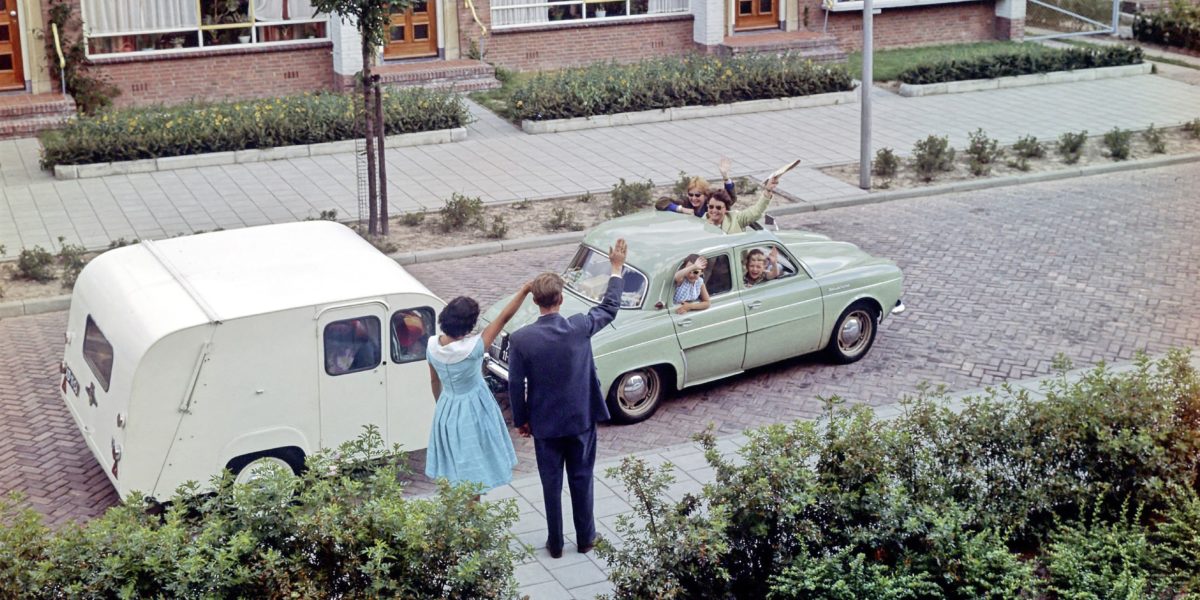
The Great Holiday Exhibition
From road maps by the ANWB and the iconic Kip caravan to the pier in Scheveningen and bikinis on the Costa del Sol, The Great Holiday Exhibition takes you through the design history of the Dutch tourist.
We’re delighted that you’re thinking about visiting us at Design Museum Den Bosch. This page has information about accessibility at the museum. If you have any questions or tips, please e-mail us at communicatie@designmuseum.nl or call us on +31 73-627 3513.
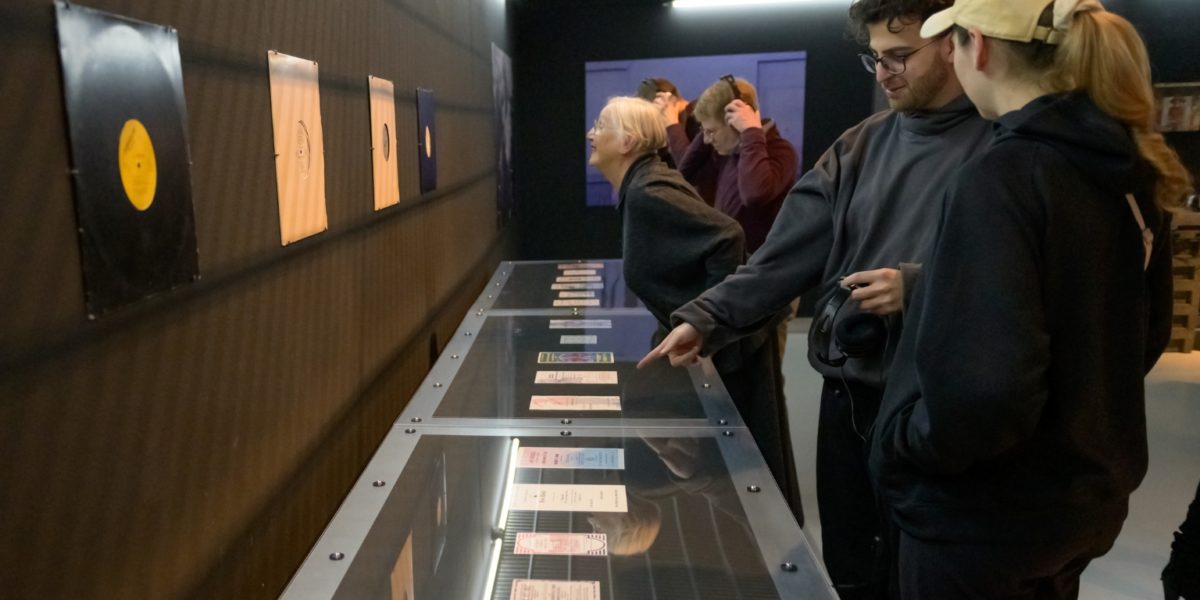
Dance has become a billion-dollar industry, with major entertainment companies calling the shots. Massive dance festivals are held all over the world, featuring an international elite of DJs flying from party to party.

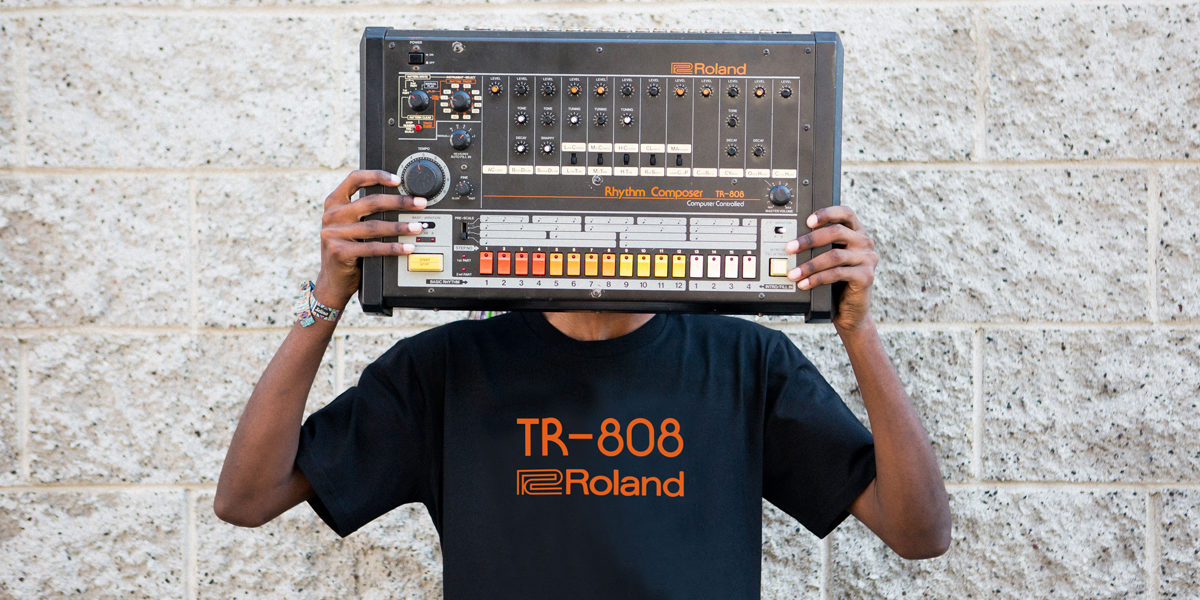
In the Netherlands, in the 1990s, gabber emerged in Rotterdam as a new branch of electronic dance music, joining styles such as house and techno that were already well-known in Europe.

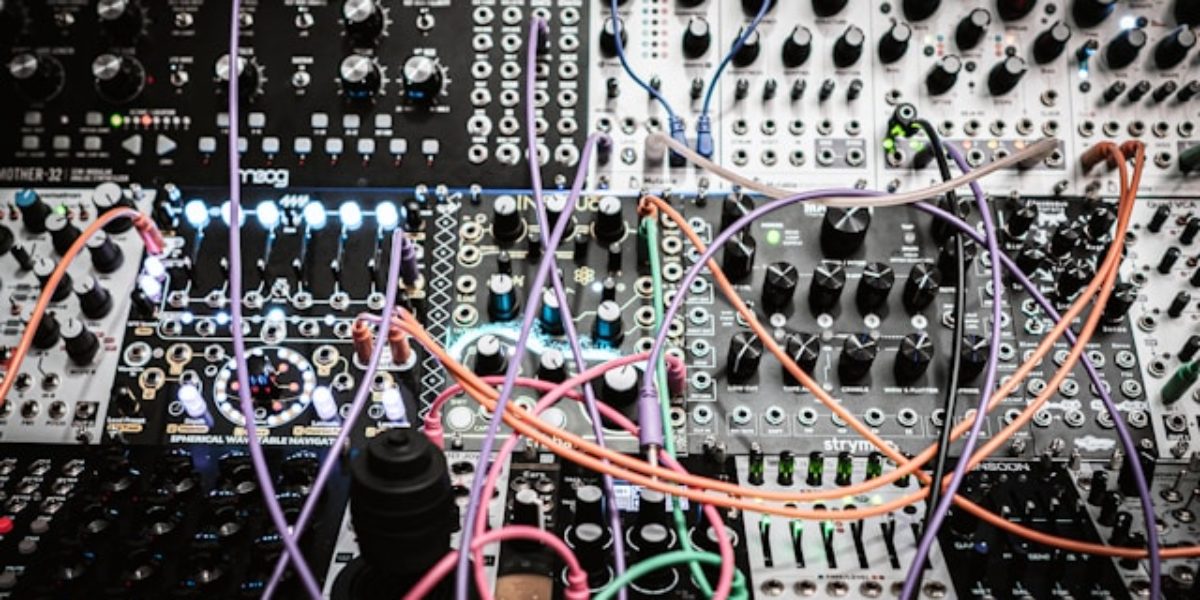
The devices with which electronic music was initially created occupied entire rooms. Now software gradually displaced hardware until, eventually, one laptop could house all synthesizers and drum machines ever released.
Liberation is ingrained in electronic dance music. It’s crafted to make you dance freely. Drums and rhythm have always been the ritual tools of dance, and that remains true in our time, albeit now generated through electricity.

Bee (Seungbee) Han developed the Bee Machine. A machine that judges potential friends on the possible success rate of the friendship.

Dance – the design of a culture
Electronic dance music is the sound of emancipation. Black and LGBTQ+ communities created a musical genre that enabled them to express themselves freely. That music has since gone mainstream, becoming a multi-billion-dollar industry. Design features centrally in the development of electronic dance music. Take the equipment used to make the music, from the first experiments…
Men, women and their appliances
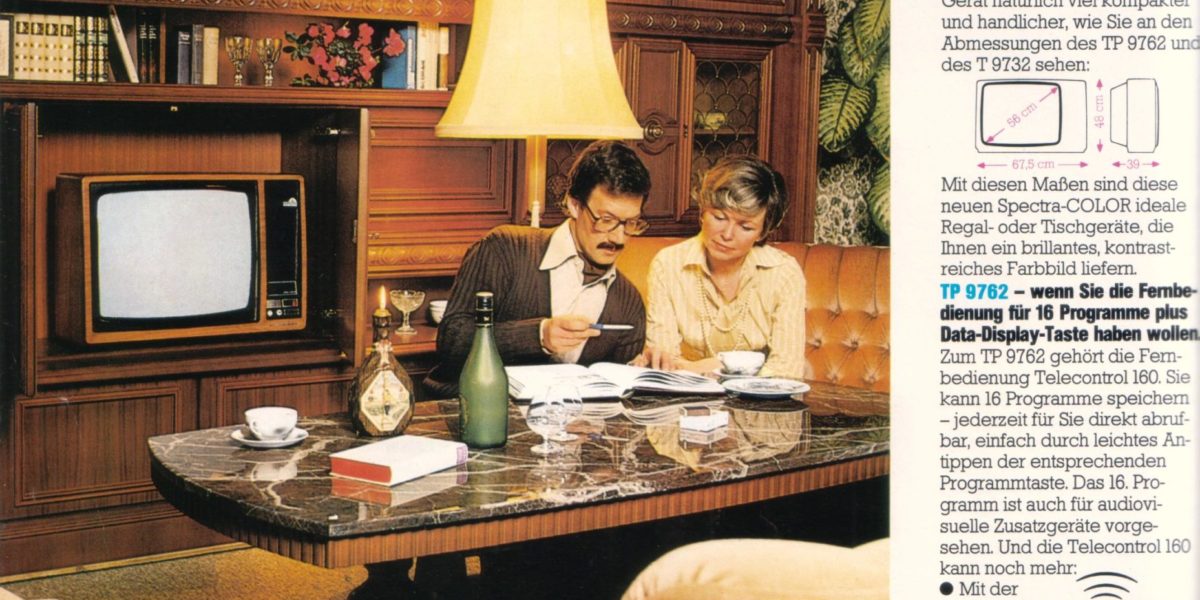
For decades now, our homes have been the stage for all manner of social transformations. Vacuum cleaners and washing machines eased the burden of housework, refrigerators, cookers and mixers changed the way we eat, and radio and television became new housemates. Especially from the 1960s onwards, this made our food more versatile and tasty, laundry…
Chair, lamp, vase and… teapot?
This presentation features a selection of teapots from the Design Museum Den Bosch collection. We are showing designs by artists like Kazimir Malevich and Cindy Sherman, colourful teapots by designers from the Memphis Group, and expressive, sculptural ‘teapots’ by American artists such as Robert Arneson and Adrian Saxe. Our extensive collection of household ware by…

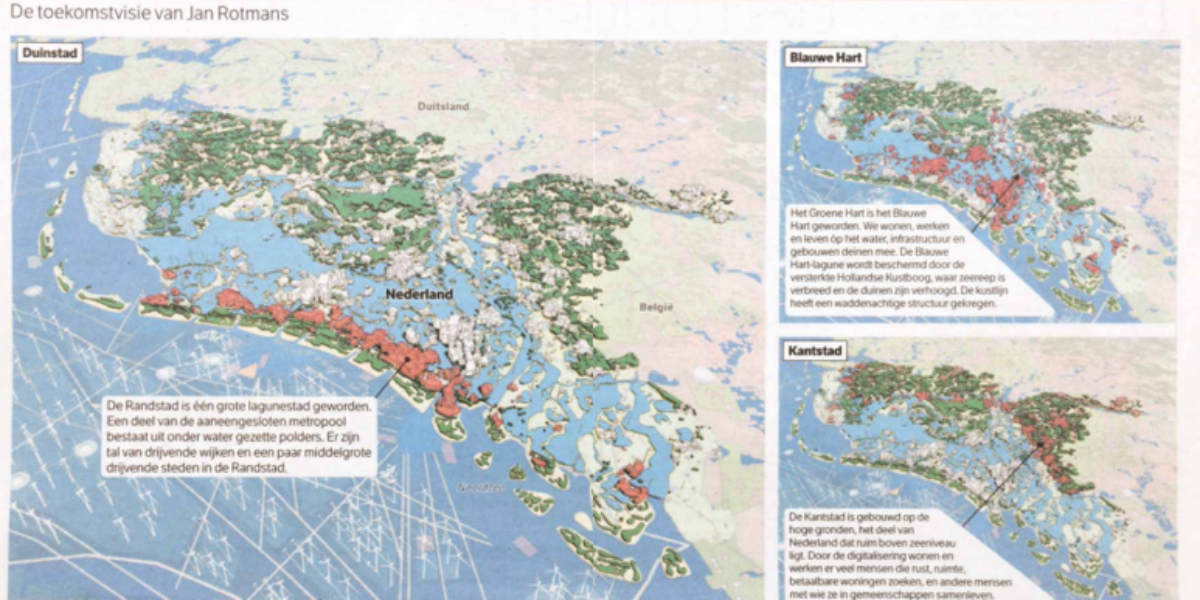
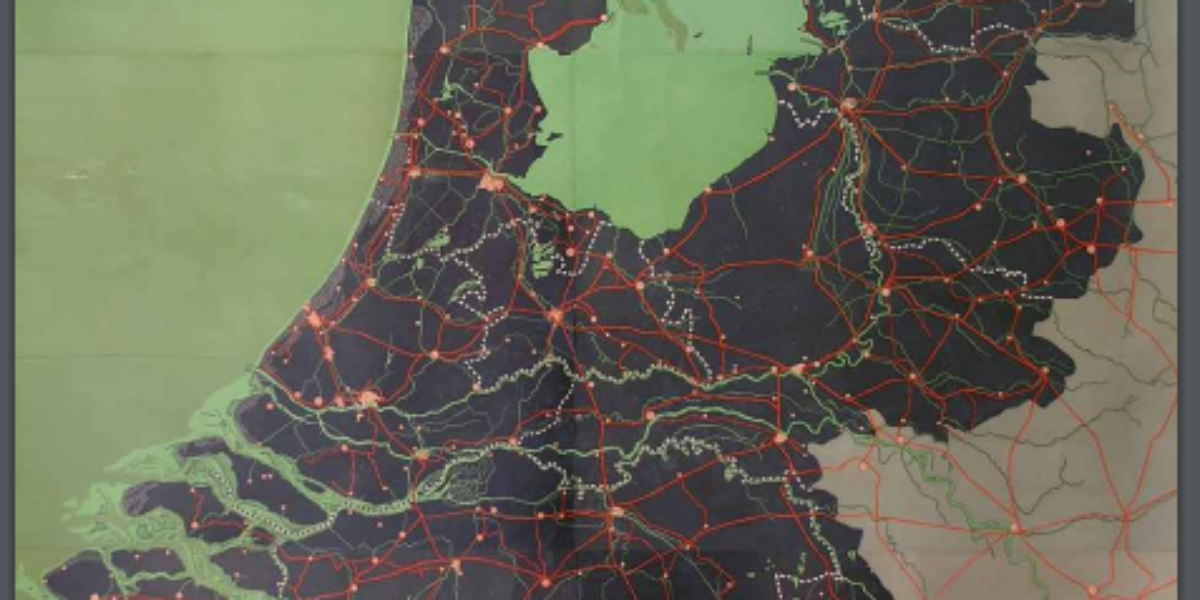
Moving in sync with nature: it can be done, it must be done Visionary talk annoys property developers, real estate moguls and investors. This map is a rough indication of what the Netherlands might look like a century from now. Jan Rotmans, Professor of Transition Science, is neither a hydraulic engineer nor a climate expert….
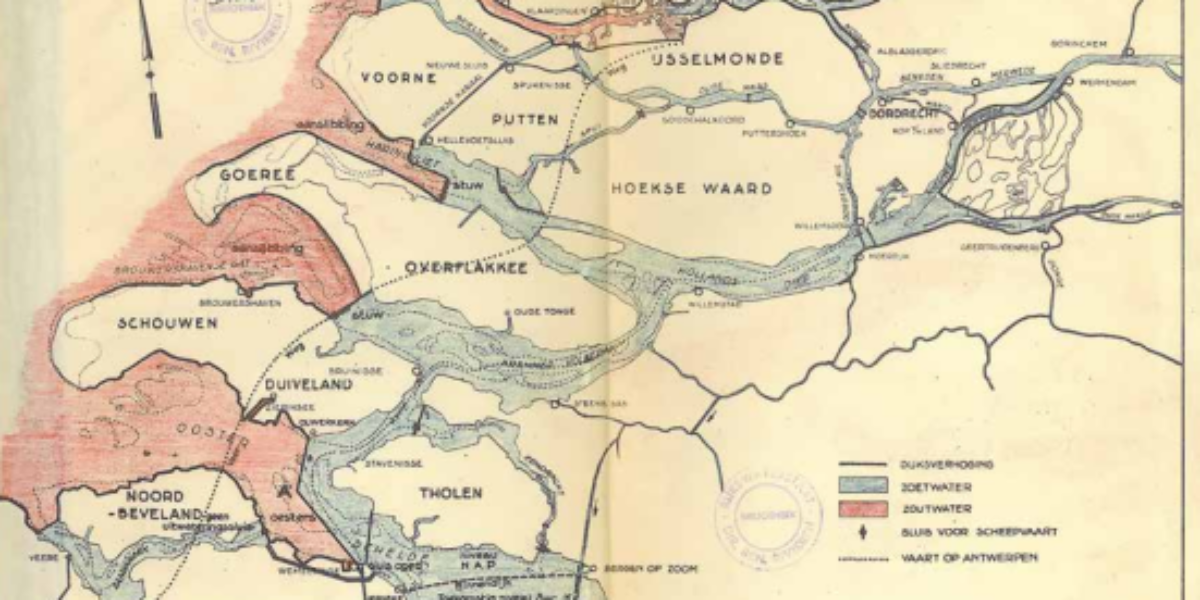
Ominous advice regarding closing off Zeeland Two days before disaster strikes, engineer Johan van Veen presents his superiors with an ambitious plan to partially dam the sea arms in the south-west of the Netherlands. A rough sketch, certainly not a technical design, but the idea is clear. The goal is in line with Lely’s plans…
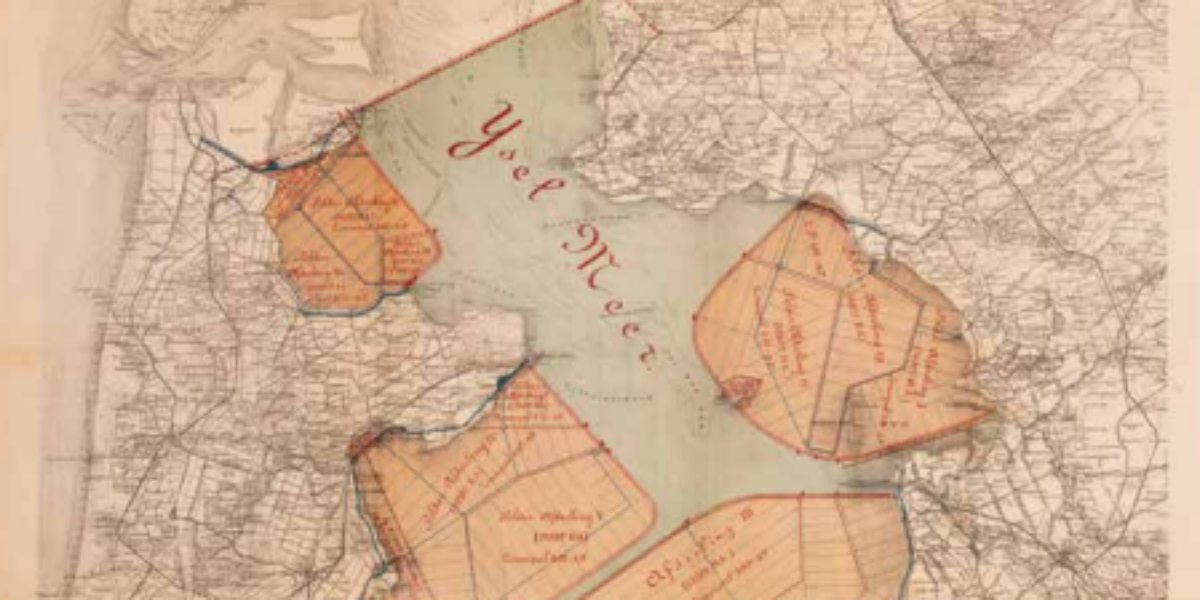
Shortening the coastline where technically possible Numerous dyke plans developed by the Zuiderzee Vereeniging preceded this design by Cornelis Lely et al. After this plan many more appeared before construction started. Lely was not only an inspired engineer, he was also a shrewd politician. During World War I, he was Minister of Water Management, and…
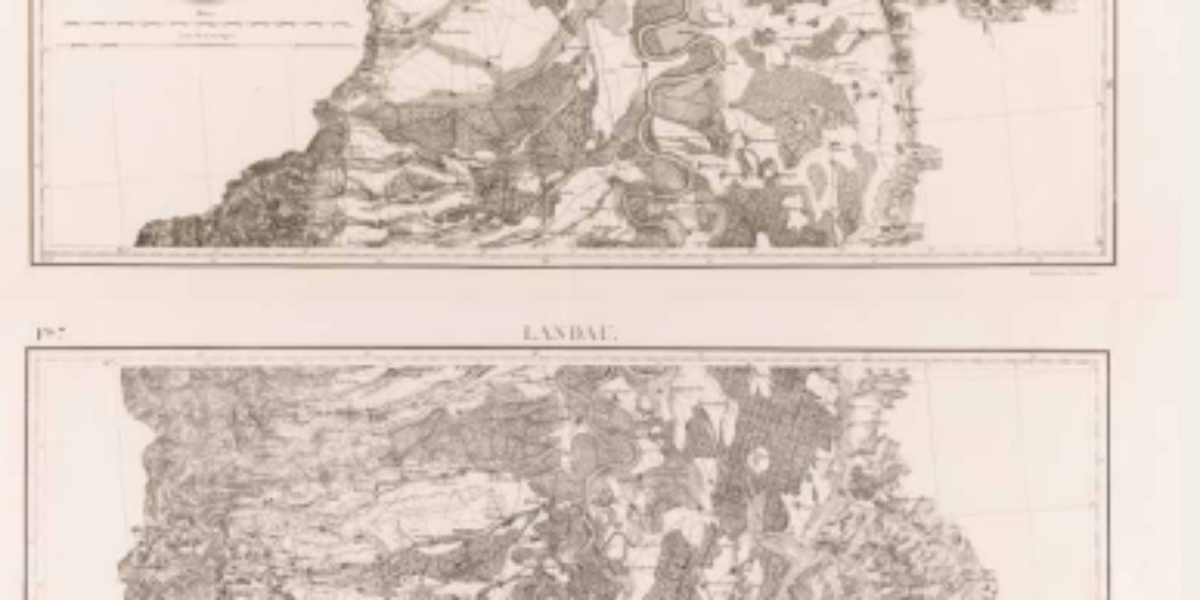
‘Modernisation’ of the natural Rhine Before modern times, the length of the Rhine is about twice as long as a straight line from city to city: the river meanders considerably and flows slowly. As a result, it offers a great deal of storage capacity, especially with so many spacious floodplains and dykes far away from…
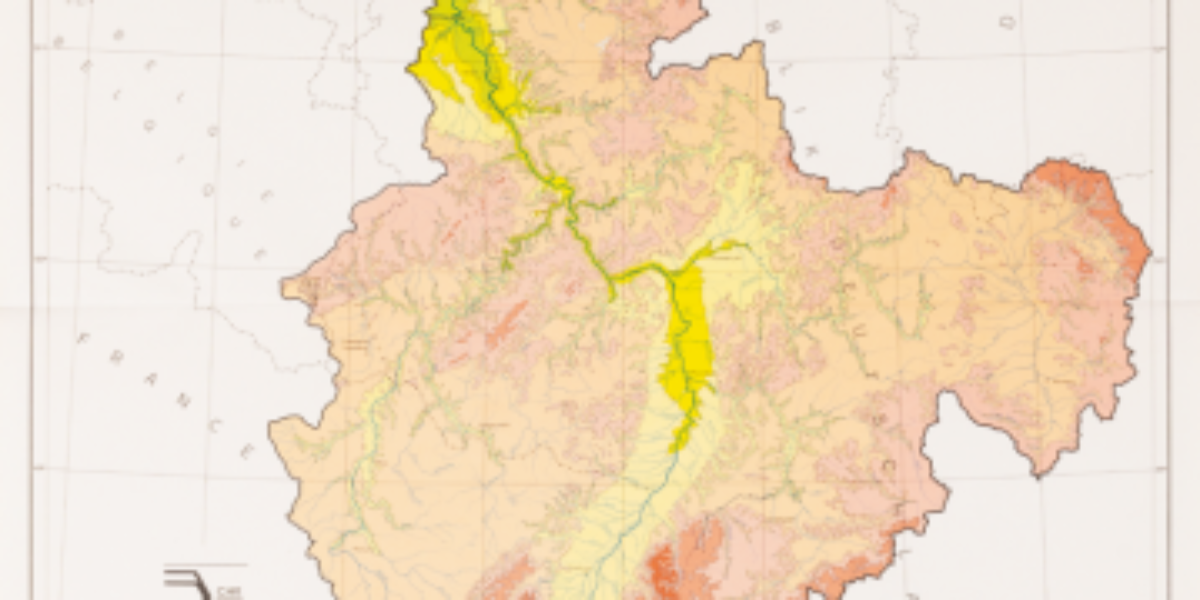
The Rhine River basin This elevation map of the Rhine River basin still shows national boundaries, but from a water management perspective, we need to look at the entire river basin. The Netherlands is heavily dependent on Rhine water, when it comes to quantity as well as quality. The melting of Swiss glaciers affects the…
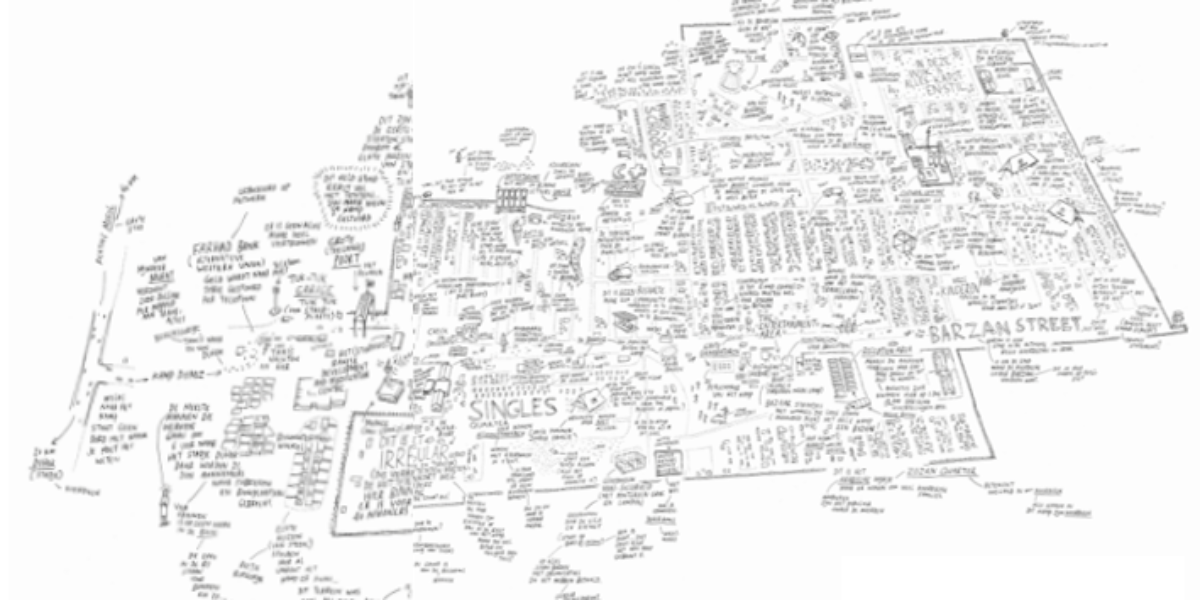
Refugee camp as a city in the making Camp Domiz in northern Iraq is home to nearly 60,000 Syrian Kurds who have fled. They expected to return soon, but most of them have been there for years. The camp has twelve neighbourhoods packed with tent houses, two hospitals and seven schools. The community abides by…
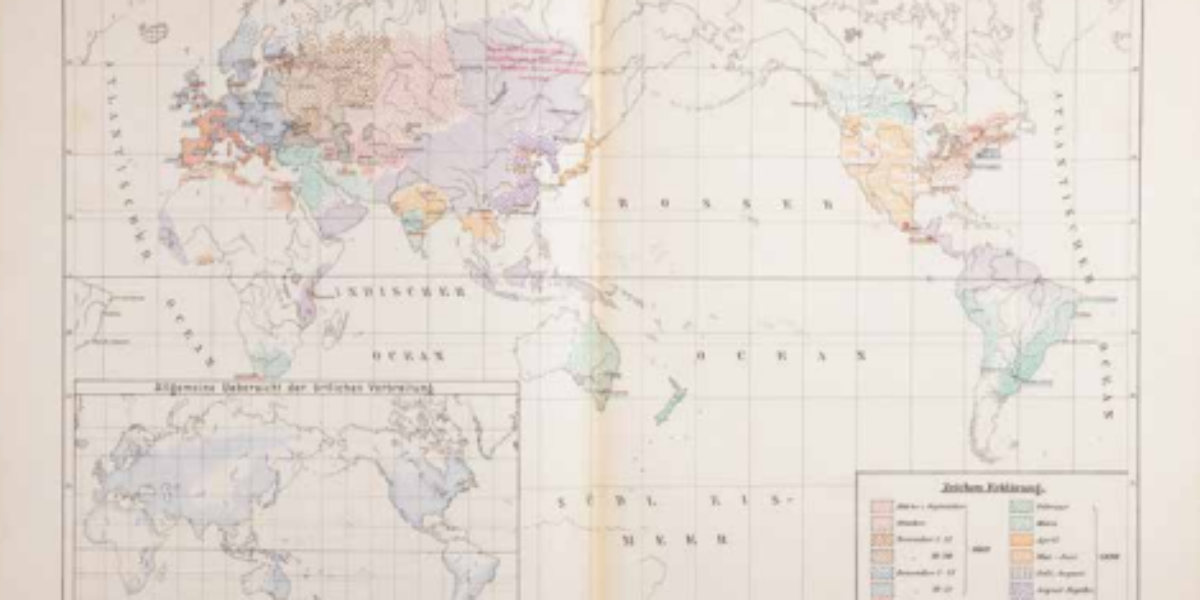
The first Corona pandemic? Not only people and animals travel around the world – germs do, too. In May 1889, doctors discover a mysterious lung disease in Bukhara (Central Asia). Pneumonia and headaches are the main symptoms, and some patients also complain of loss of taste and smell and extreme fatigue. In the first months,…
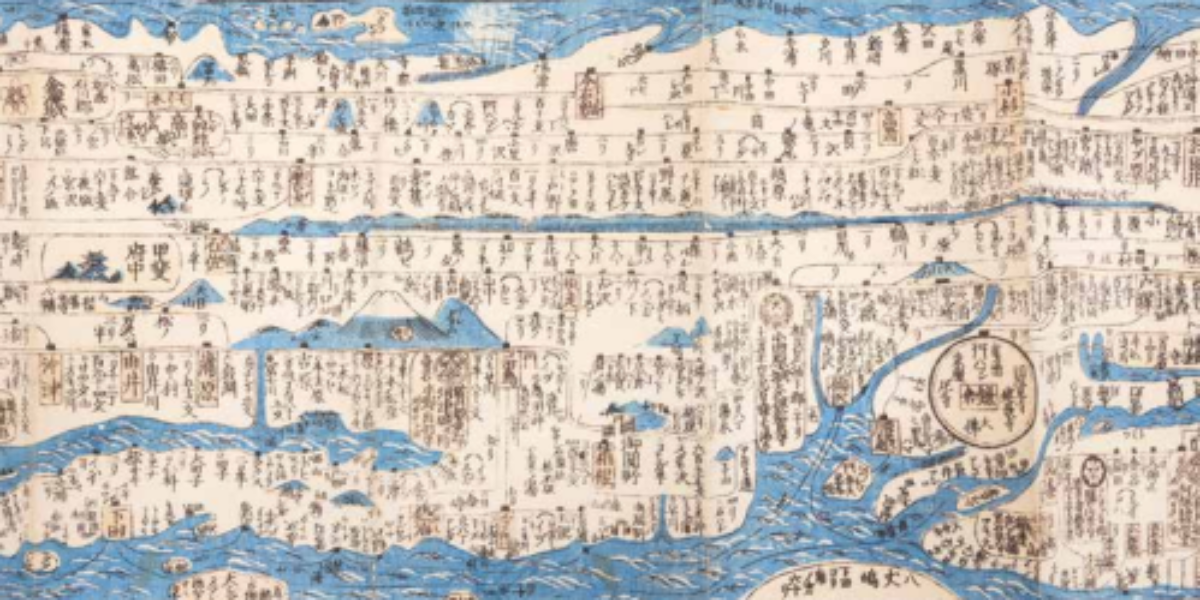
Safe travel navigating by the constellations: Japan This hand-tinted map was originally harmonica-folded but has been pasted and fitted with sidebars for the purpose of protection. You can see mid-19th century Japan, shortly before American gunboat diplomacy forced the country out of its isolation. This is a ‘dochuzu’, a road map with compass indications for…
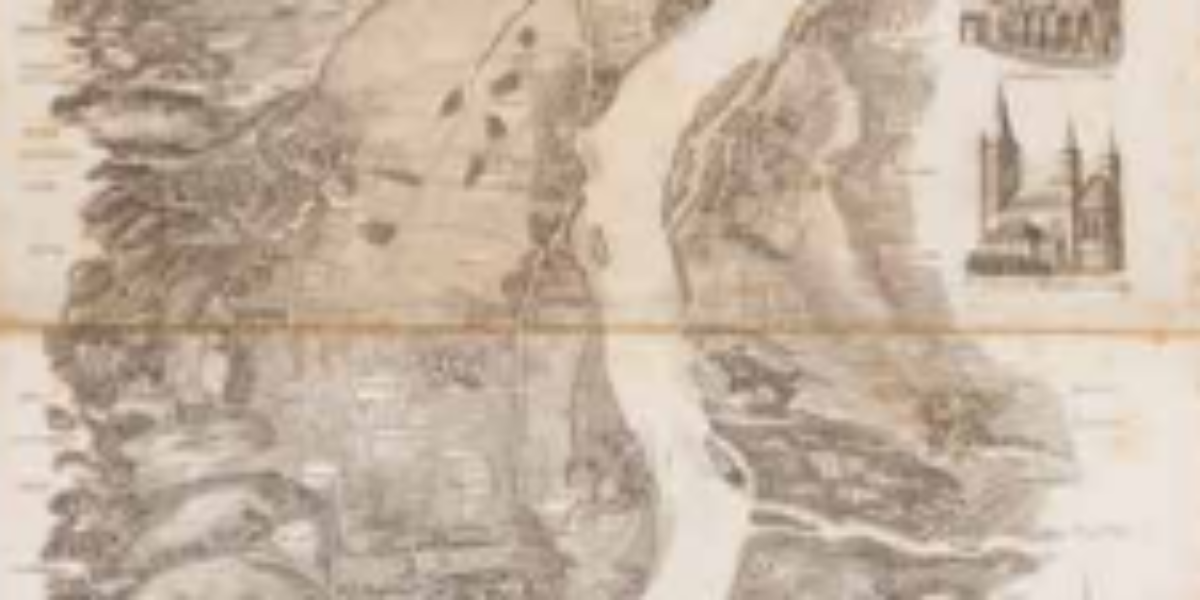
Mass tourism begins on the Rhine During the Napoleonic Wars, the Middle Rhine is already no longer seen as a border, but the romantic subject of German song. After Waterloo, English painters such as Turner and poets such as Lord Byron create legendary impressions of the Rhine in images and words. In May 1827, two…
Just time zones This fascinating digital map from the ‘Cartographers without Borders’ website delineates global time zones. Since 1972, the modern time standard (UCT) has been based on an atomic clock attuned to the earth’s rotation. The UTC is the successor to the Greenwich Mean Time (GMT) and differs from this by no more than…
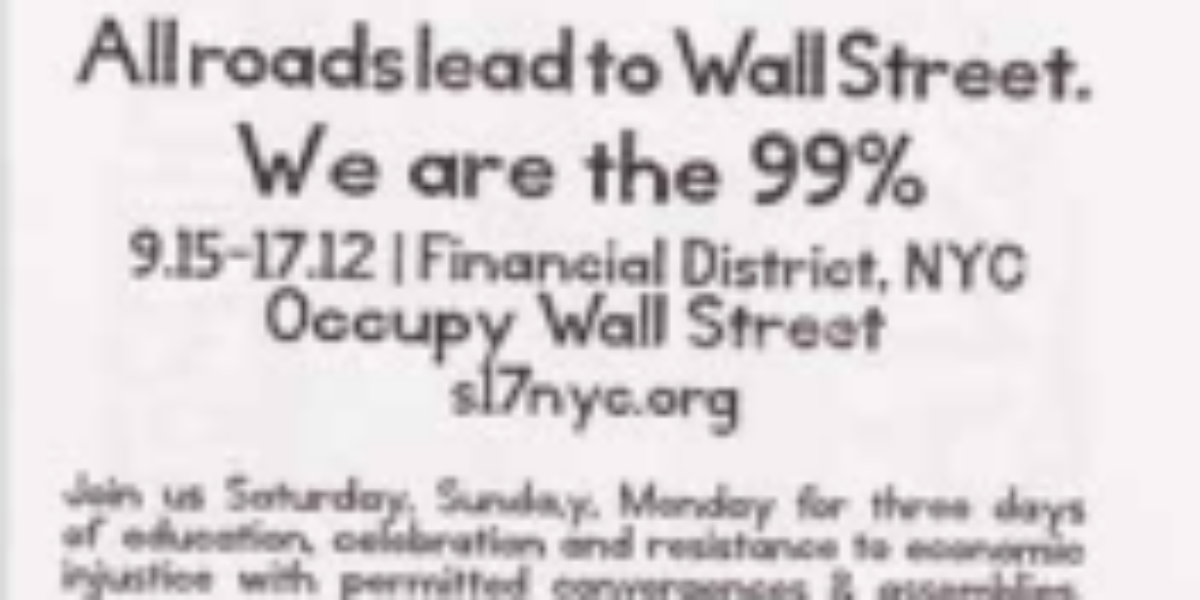
Occupy Wall Street When the credit crunch causes house prices to plummet and forces millions of people default on their mortgages, Wall Street threatens to crash in the autumn of 2008. To prevent another – by now global -economic crisis, Bush and Obama organise a huge investment bank bailout. However, shifting the cost of the…
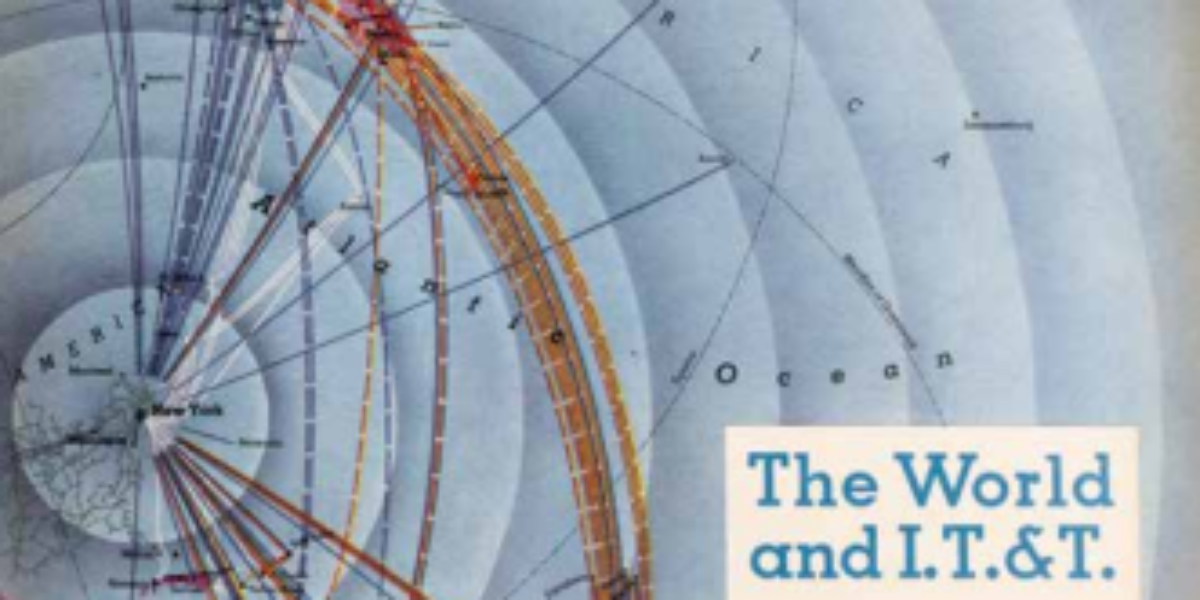
The world of IT&T Scientific illustrator Edes Harrison plays a key role in developing cartographic perspectives that radically change everyday spatial concepts while America emerges as a superpower. This distance-focused twopoint map projection presents the entire world from two centres, places at the same distance from the centres always lie on one circle. Here, the…
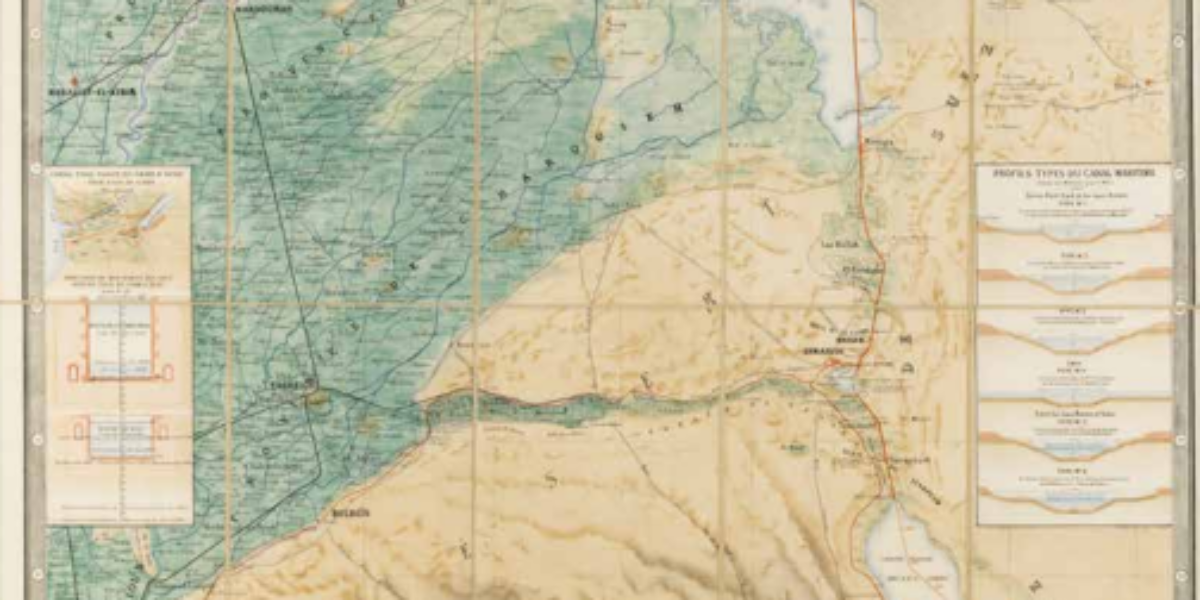
Official map of the Suez Canal This rare chromolithographic map of a waterway without locks (the thick red line) through the isthmus between Port Saïd and Suez appears three years before the grand opening of the Suez Canal. A publication of the responsible joint-stock company,it is intended to promote the modern mega-project and is to…
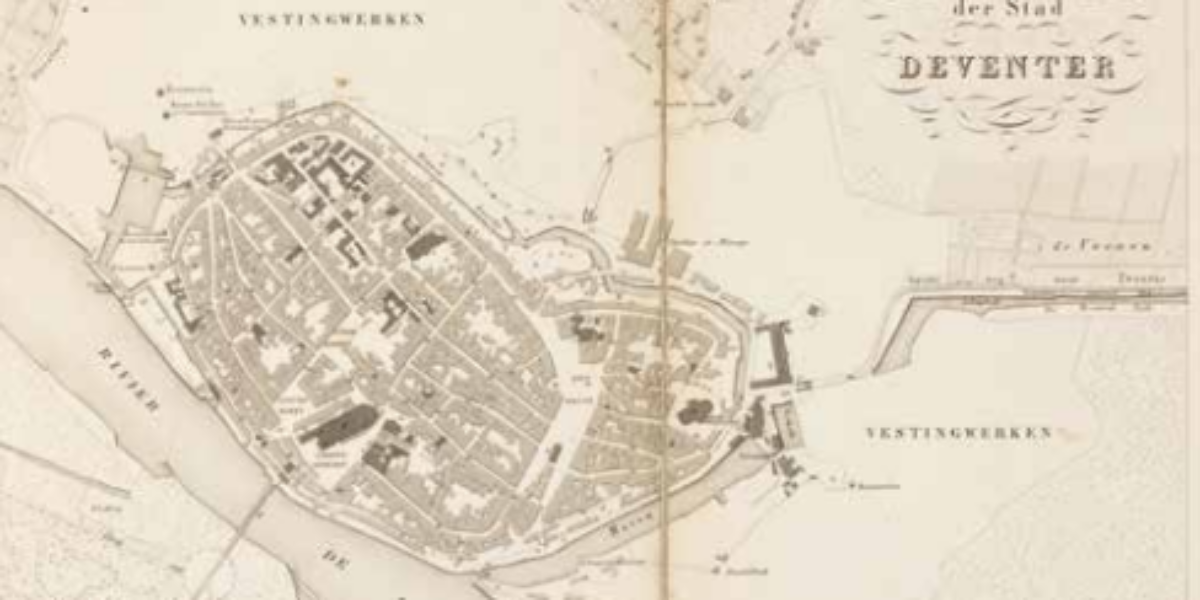
First modern map of Overijssel In the nineteenth century, unmeasured and undescribed places not only disappear from our world maps, but the interior is also increasingly mapped. Based on triangulation of our country by Kraijenhoff and systematic mapping by the Cadastral Registry, accurate provincial maps were made at the insistence of the Minister of the…
Most commonly used cards: coins We pay less and less with it, but even our coins have a map. The five-euro cent shows a globe with Europe in the centre. The fifty-euro cent shows the European Union, regardless of whether countries have adopted the euro, and the two-euro coin shows all of Europe, including Norway…

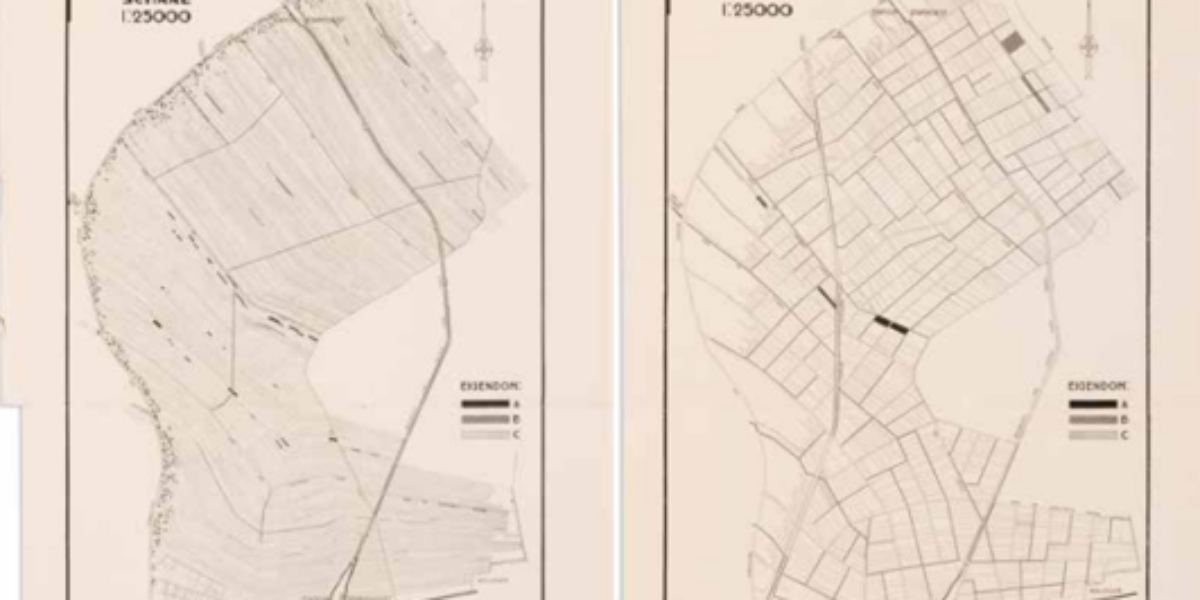
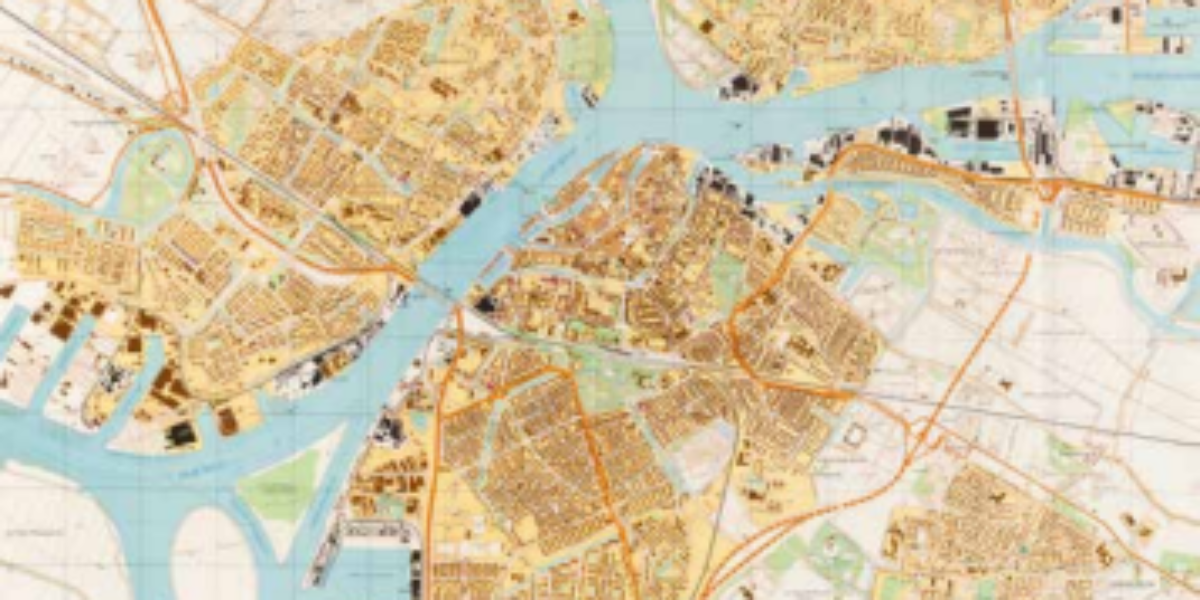
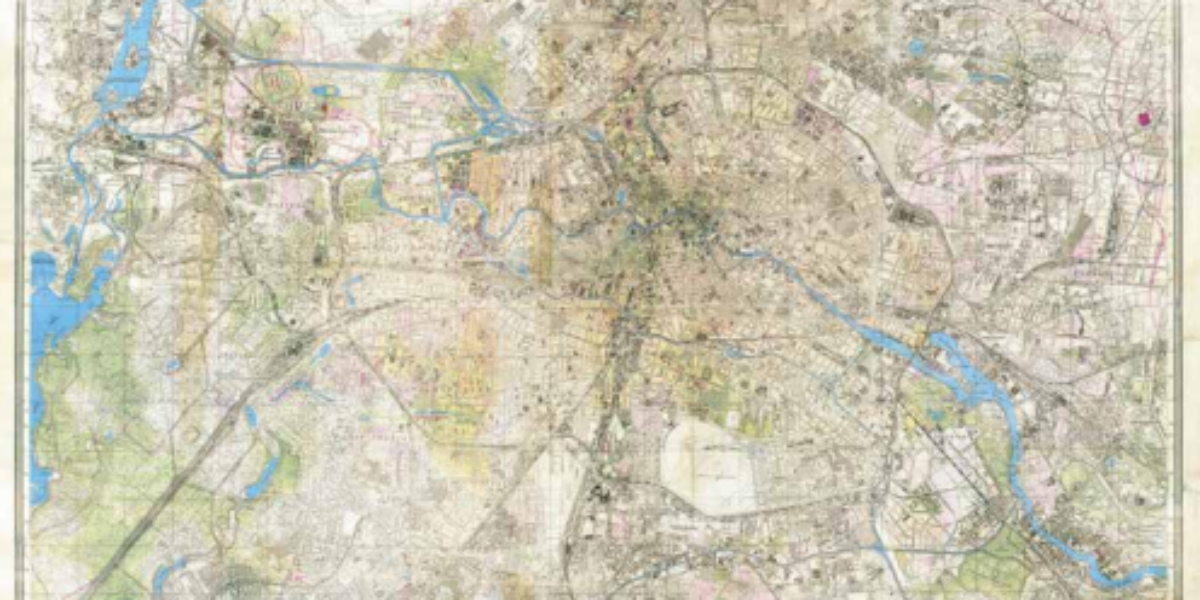
Soviet maps of Dutch cities Immediately after World War II, Stalin orders the world and all countries and relevant cities to be mapped. It is the largest cartographic project ever. Almost all larger Dutch cities are mapped in scales 1:10,000 or 1:25,000. The maps are still ‘secretno’, secret in Russia. Dordrecht and Maastricht are depicted…
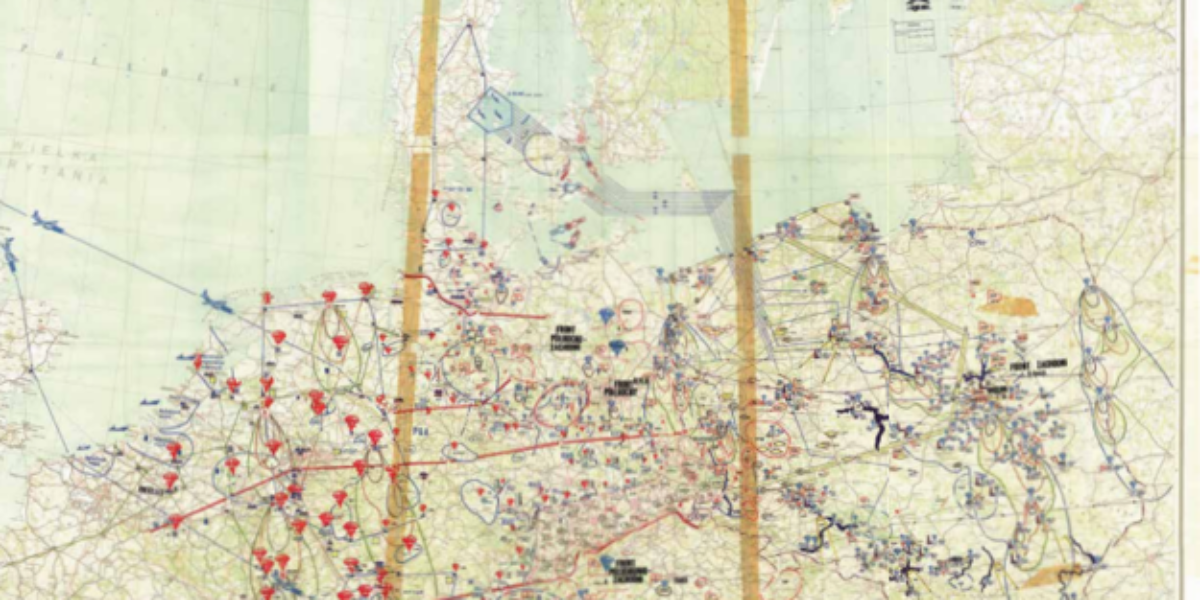
Threatening nuclear attack on Western Europe This Polish-language training map for a large-scale attack from the east was made public in 2005 from a Polish state archive. The plan of attack involves throwing ‘tactical’ nuclear bombs at Western Europe, but not at the nuclear powers UK and France. Called ‘tactical’, those bombs are up to…
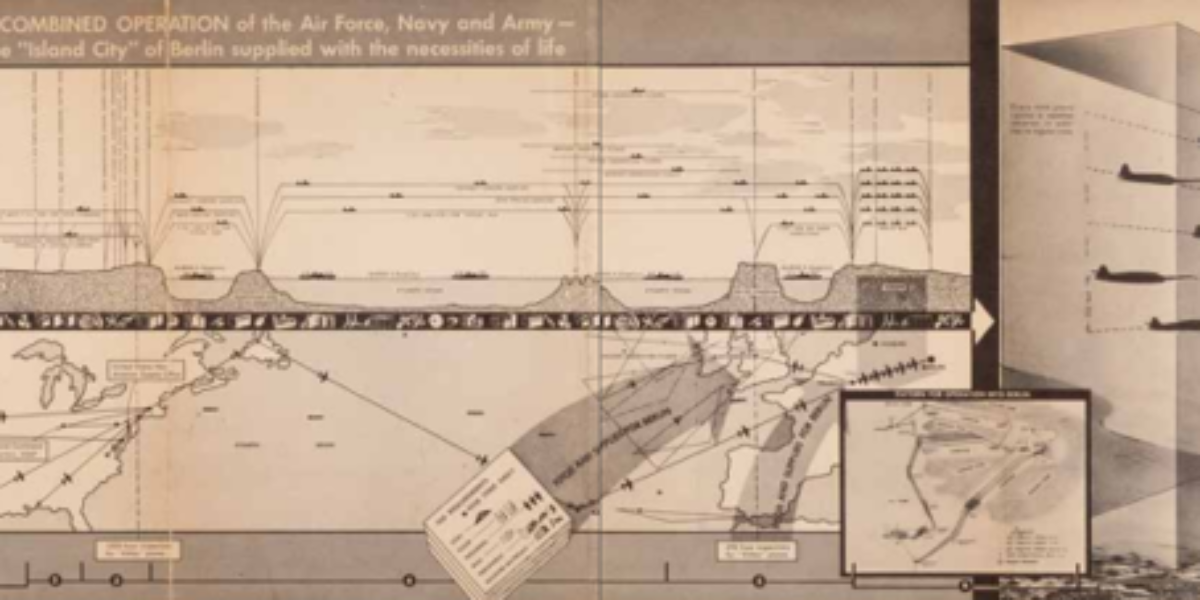
Berlin lifeline during land blockade This propaganda leaflet with cartographic infographics shows how an airlift negates the land blockade of West Berlin by the Soviets in 1948. The leaflet visualises the logistical operation required to provide people, food, fuel and building materials for 2.5 million West Berliners get to their destinations by plane. When this…
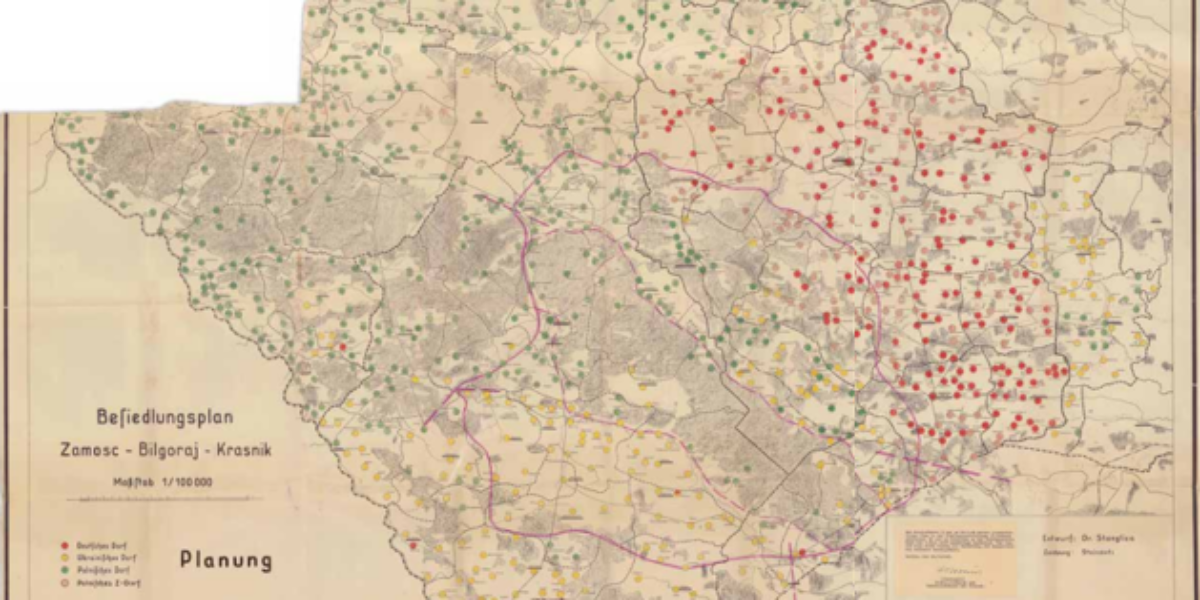
German peasant soldier colony Reichskommissar Himmler puts SS and Polizeiführer Globocnik of Lublin District in charge of the Germanic colonization project in the region around Zamosc, currently in south-eastern Poland. After the Jews had been deported, some 110,000 Poles and Ukrainians in 294 villages are arrested and racially selected between November 1942 and August 1943….
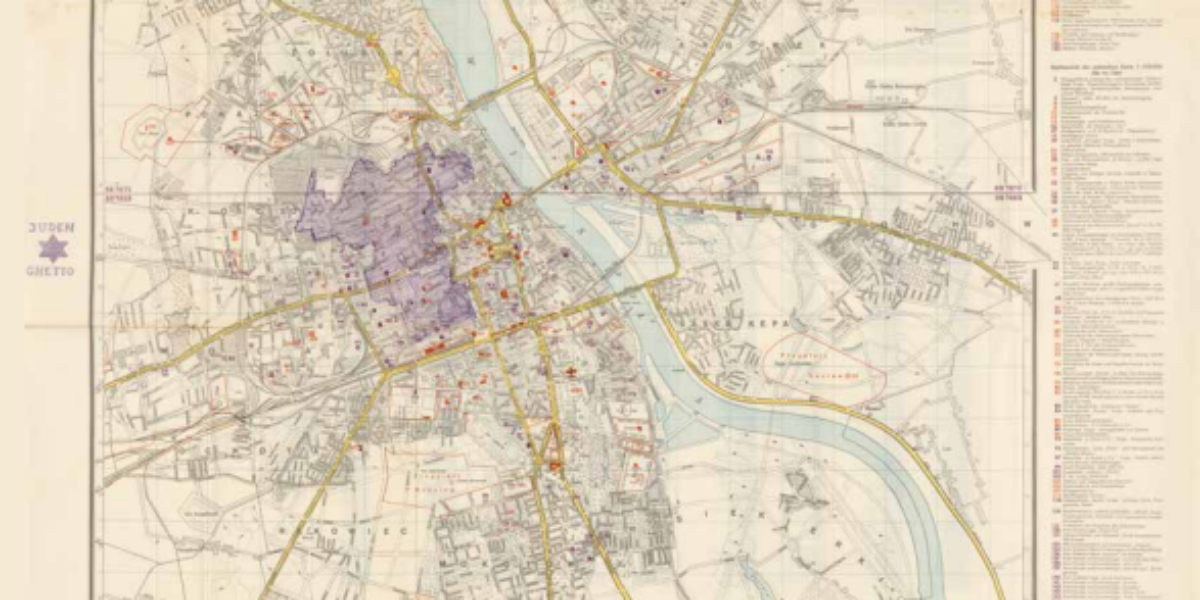
The Warsaw ghetto Around November 12, 1940, ‘SSSturmbannführer’ Max Jesuiter traces the area for a new Jewish ghetto on a secret military map of Warsaw, in purple pencil. The plan stems from an ordinance by the German governor, but the erratic borders result from quarrels between Jews and Poles over living space allocated to them….
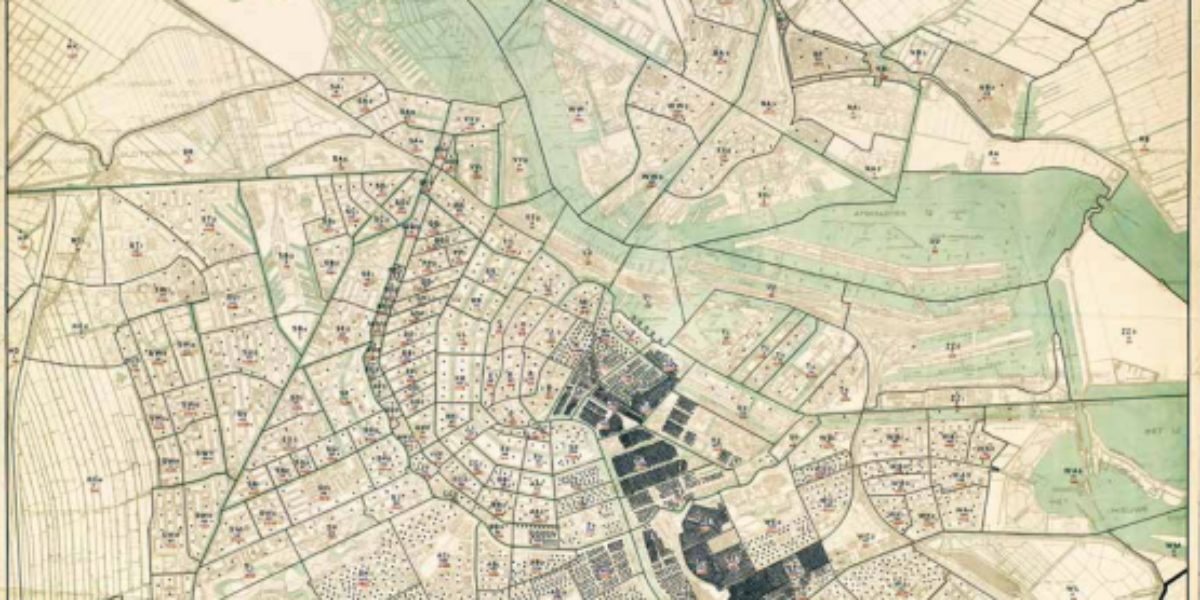
Each dot = ten Jews In January 1941, Hans Böhmcker, ‘Beauftragter des Deutschen Reiches’ for Amsterdam, demands an inventory of the distribution of Jews throughout the city. Within ten days, twenty officials have prepared a first overview. After this, the municipality collects additional data on the Jews. In May 1941, 85,897 Jews were settled in…
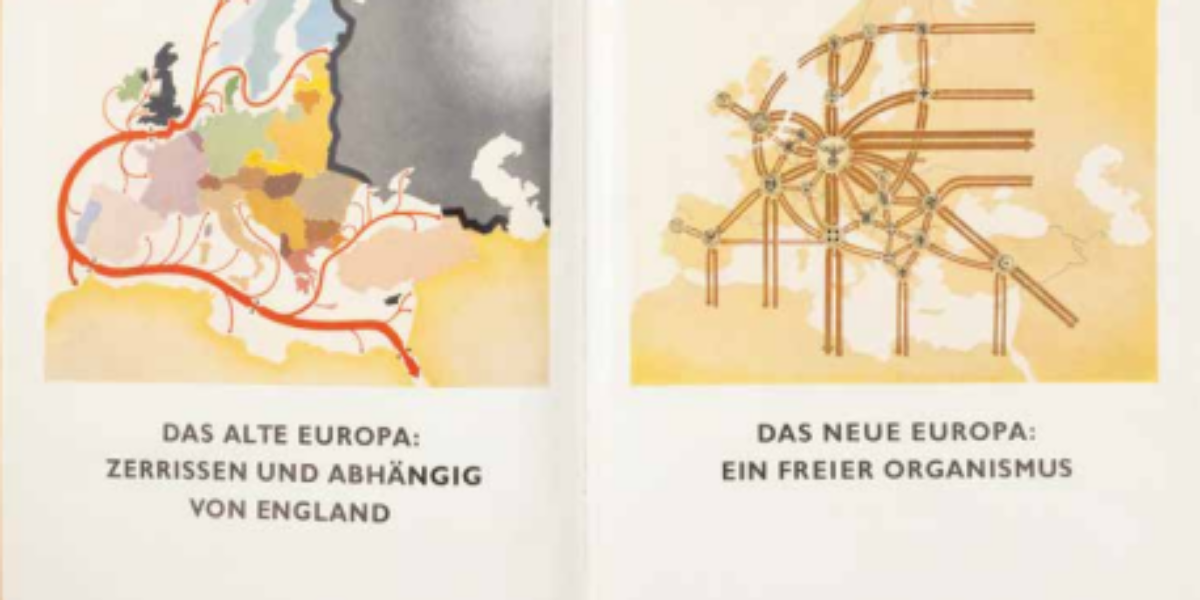
Old and new Europe These National Socialist maps were specially created for the ‘Autobahn und Wasserstrasse’ exhibition for Danube vassal states, organized by Reich Minister Todt (Armaments and Ammunition) in Budapest, Belgrade, Sofia, and Bucharest in 1942. On the left we see ‘Old Europe’, with its rivalling nation-states in a variety of colours. The British…
Second atomic bomb destroys Nagasaki This sober report analyses the effect of the atomic bombs on Hiroshima and Nagasaki (6 and 9 August 1945) compared to ‘ordinary’ bombings of other Japanese cities. ‘Nagasaki’ was less effective than ‘Hiroshima’ due to the hilly terrain, but the overall effect turned out to be greater, owing to the…
Destruction and fall of Berlin This extensively restored working copy belonged to Major General Safaryan, commander of the 89th Armenian Infantry Division, and is part of his estate. The map shows the division’s progress during the Battle of Berlin in April 1945. The division attacks from the north (Wilhelmsruh) and is the second division to…
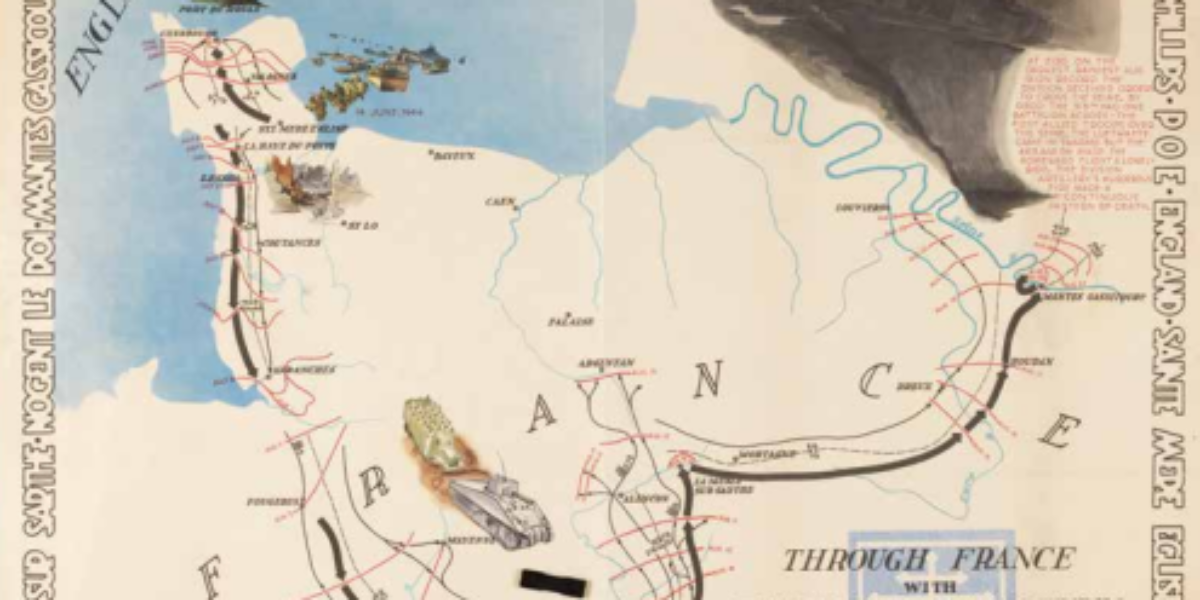
Hollywood-inspired ‘debriefing map’ Four large sheets depict a US division’s participation in the Allied advance following D Day. The beautifully designed frame tells the story of the 79th division. This starts at training camps in the United States and England and depicts each of the places the division passes through. In addition, special actions are…
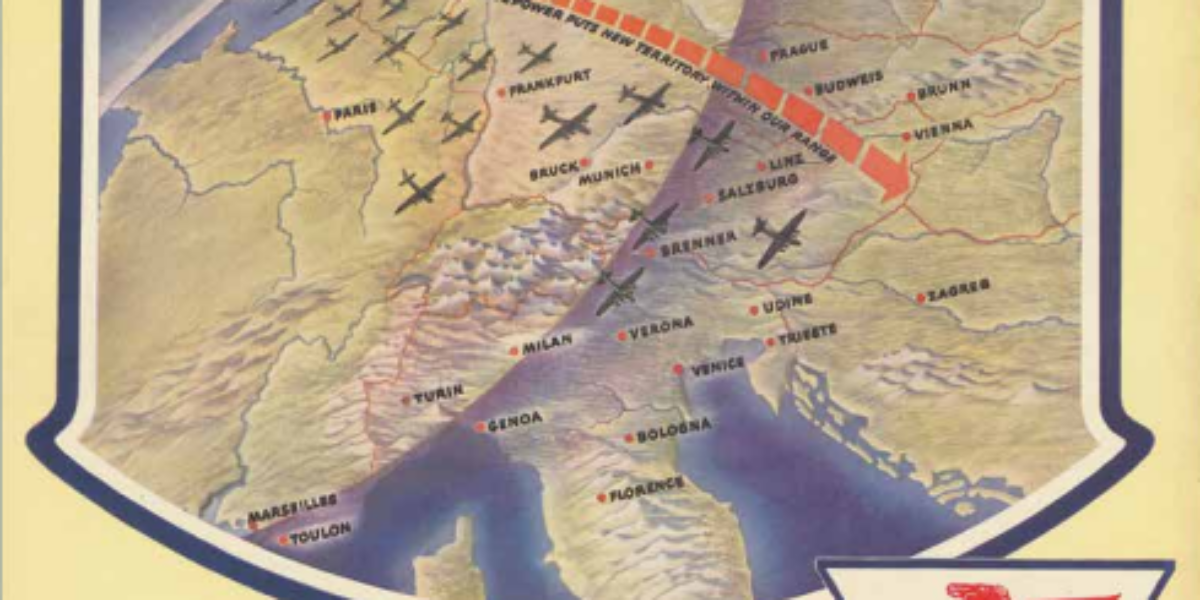
War success as publicity War has always acted as a catalyst for technological innovation. With this in mind, the US developed a more efficient fuel that enhances flying range. This ‘super fuel’ has a higher octane rating, which means greater ‘flying horsepower’, speed and payload and increased range, without requiring a more powerful engine. B17s,…
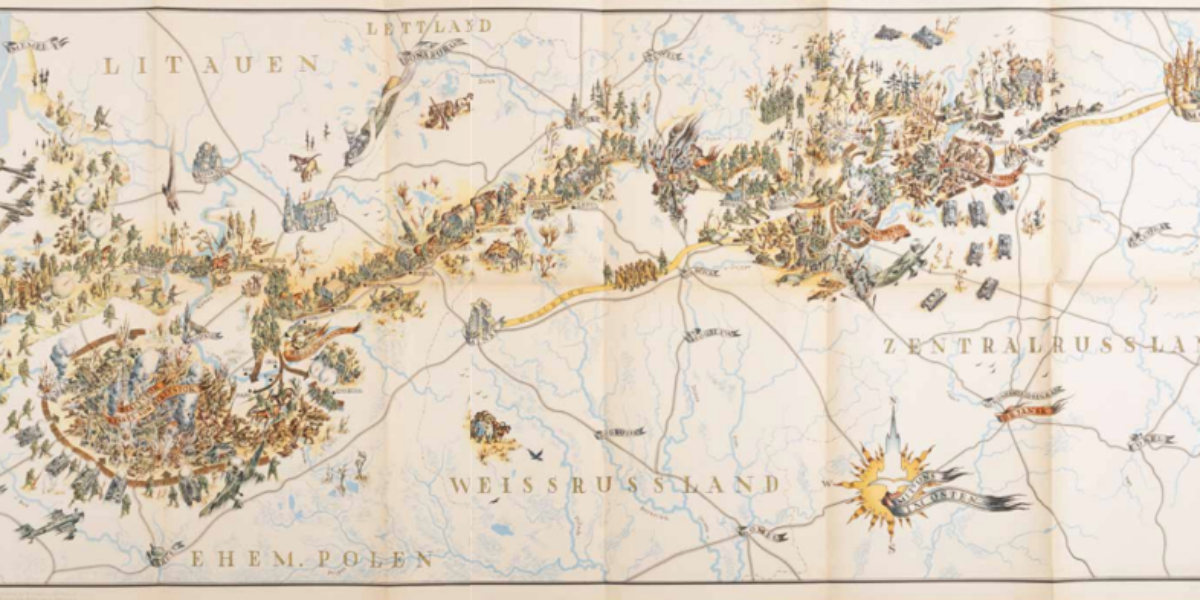
Cheerful ‘Rollbahn’ to Moscow In January 1942, the Wehrmacht propaganda department authorises publication of this map and an accompanying book of photographs. The map has a cinematic, fresh, and cheerful appearance, but the consequences of the war on show are gruesome. During Operation Barbarossa, the Ulmer division advances to invade the Soviet Union, part of…
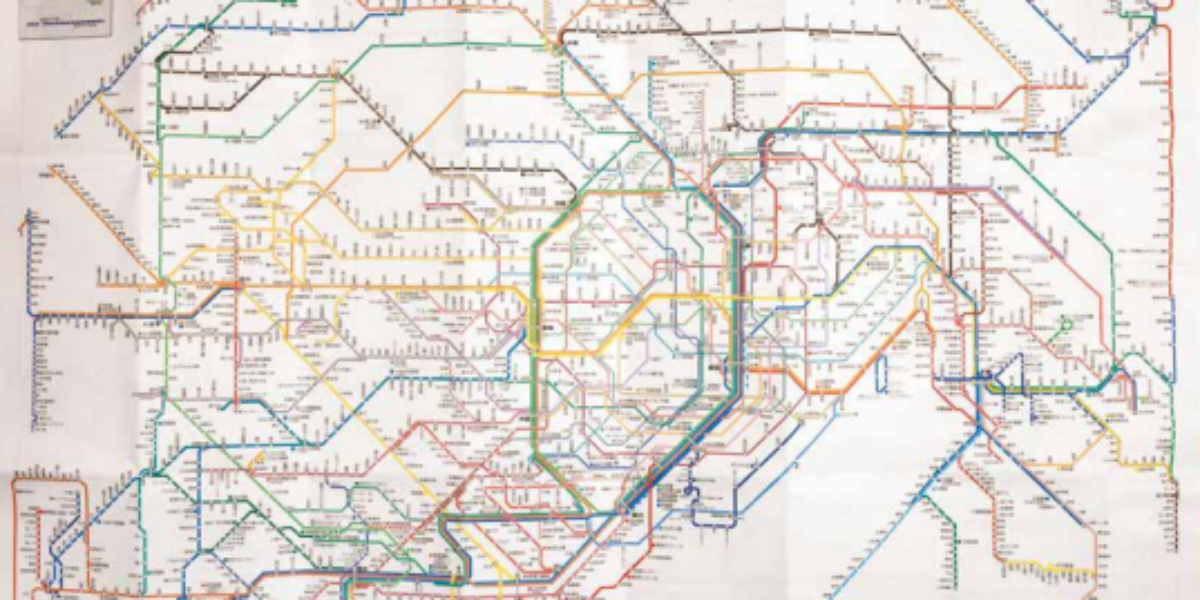
Tokyo as modern design Even when using the smartest design methods to schematise underground and overhead rail networks, representing rail lines of the world’s largest metropolises results in a practically illegible jumble of lines. This is a schematic map of almost all public heavy rail transport in the Greater Tokyo area: a mega-metropolis of 35…
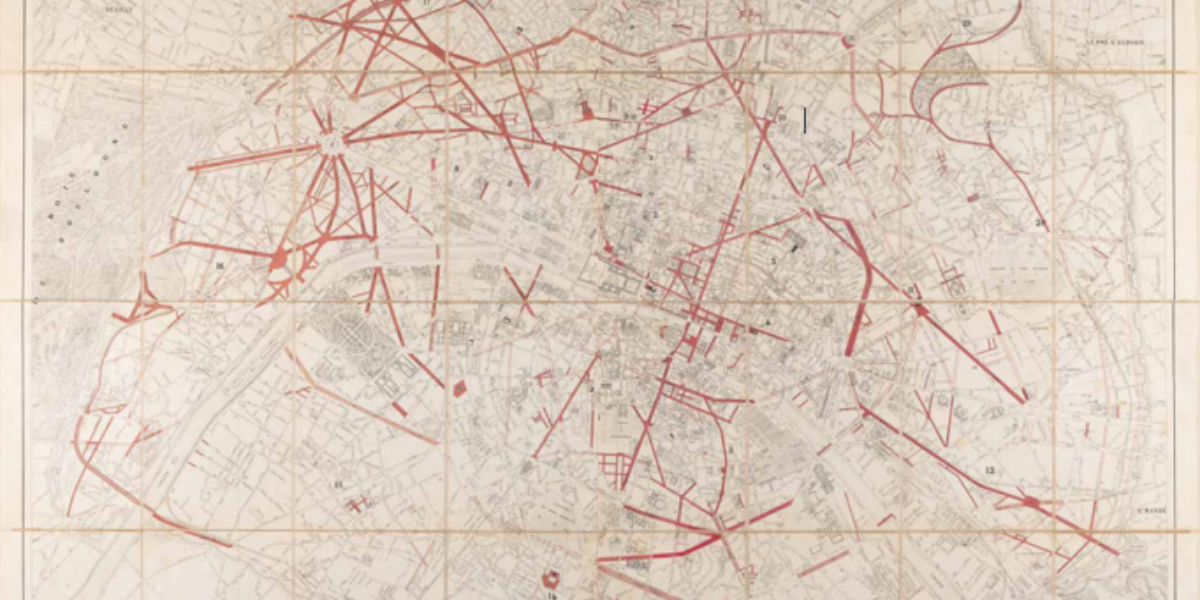
Paris: modernity versus revolution On the initiative of Napoleon III, France’s last monarch, Georges-Eugène Hausmann, capital prefect, modernises the Paris urban structure and street layout. Napoleon III personally sketches the designs for this. At the time of this map’s publication (1867), the work is largely complete. The city is seen as a living organism where…
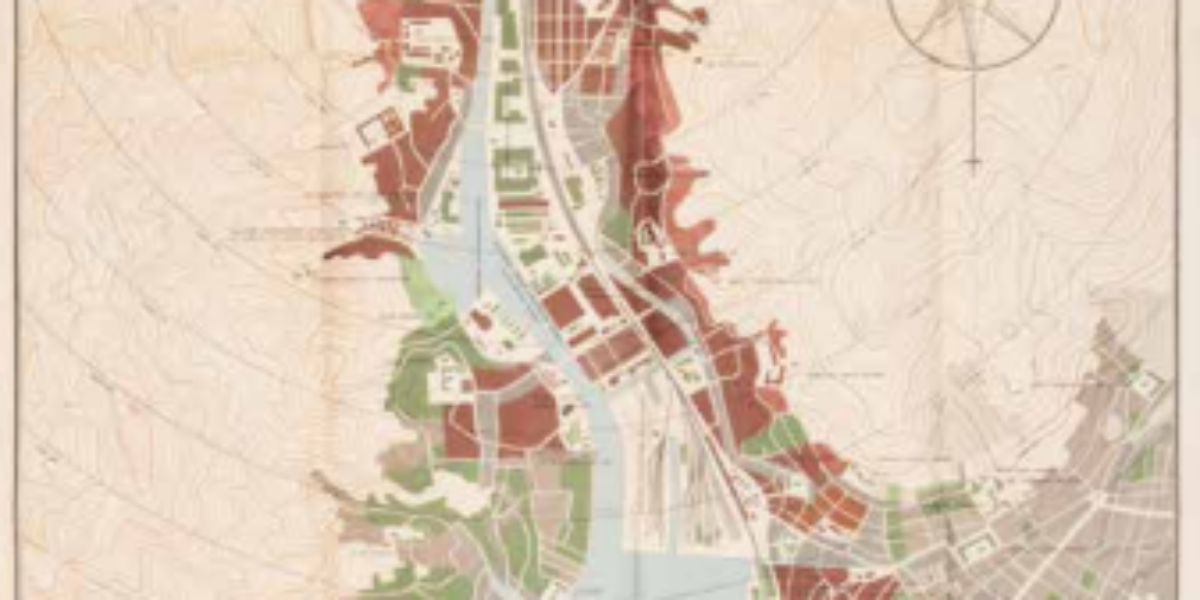
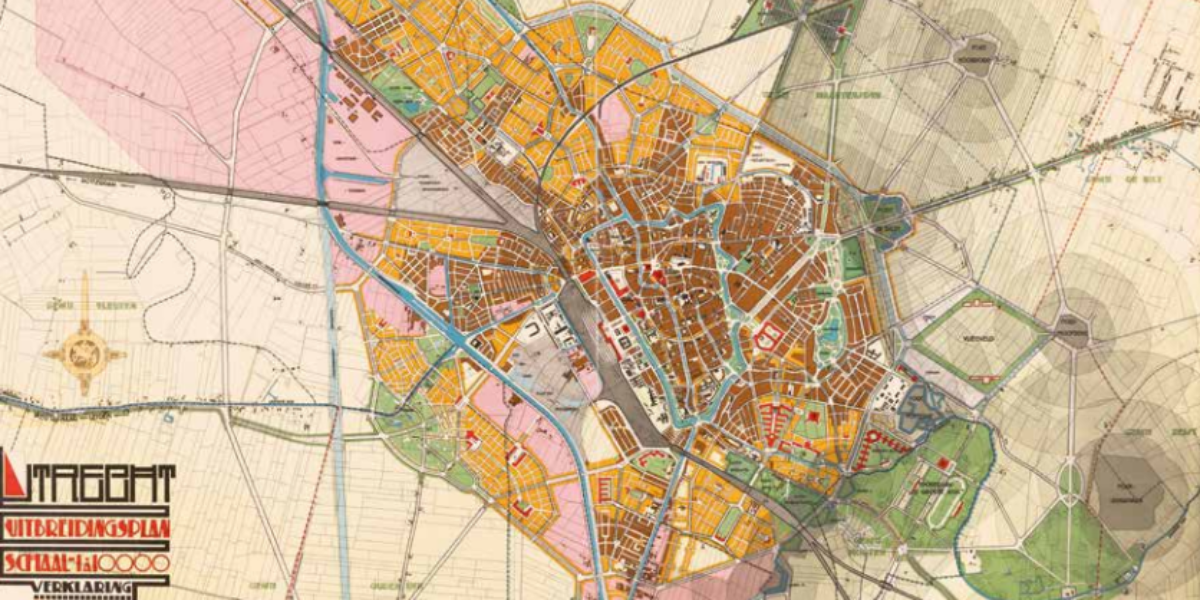
Waterline hinders expansion of Utrecht Hein Berlage is commissioned to design an expansion plan for Utrecht, together with director of Public Works L.N. Holsboer. At the time, Berlage has become renowned as an acclaimed urban planner. Utrecht is located near the Nieuwe Hollandse Waterlinie, an 85-kilometre stretch of forts, castles, and strongholds. The duo takes…
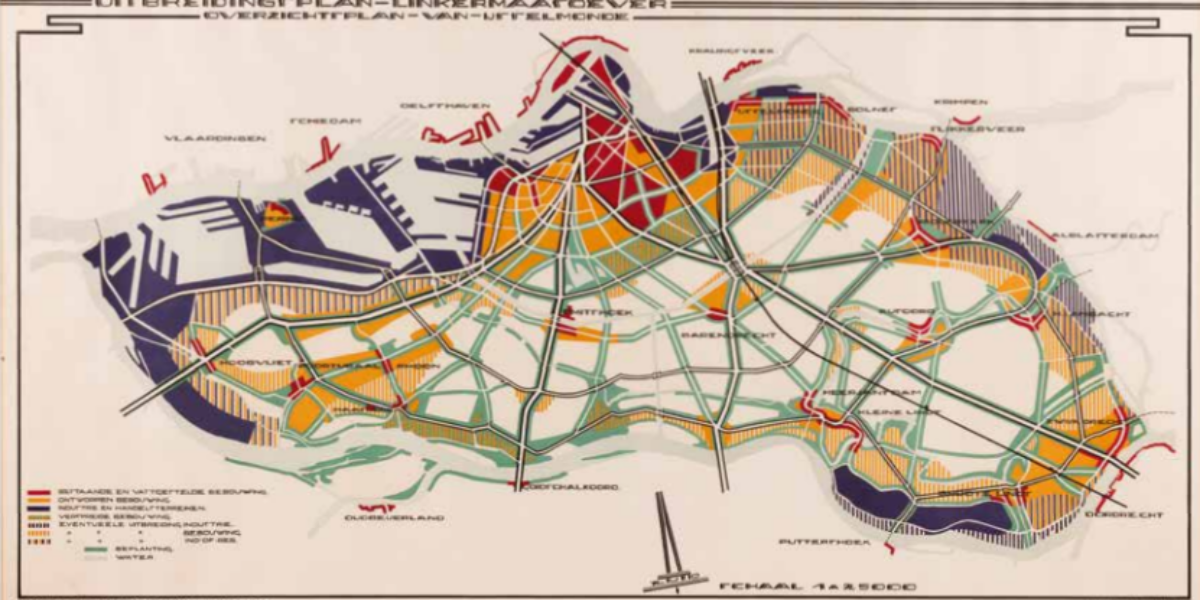
The first regional plan: IJsselmonde Commissioned by private Rotterdam investors, architectural firm Grandpré Molière, Verhagen & Kok develops an expansion plan for Rotterdam’s south bank in 1921. The Netherlands’ first ‘regional plan’ includes the entire IJsselmonde island. Space is needed for intensive industrialisation and working-class districts, as well as for heavy infrastructure, greenery, and recreational…
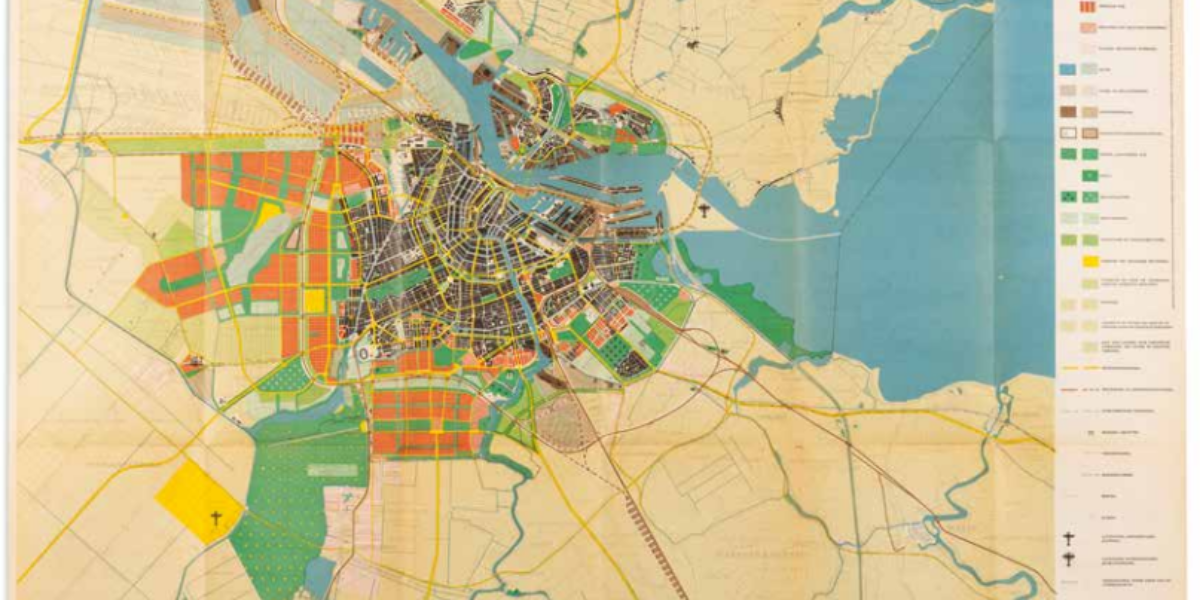
Amsterdam as a functional city Urban designer Cornelis van Eesteren has a significant influence on urban development in the Netherlands. In 1929, he became Director of Amsterdam’s Public Works Department, where he developed the Algemeen Uitbreidingsplan (General Expansion Plan) with Th. van Lohuizen. His approach to designing and drawing is strongly influenced by the ‘Congrès…
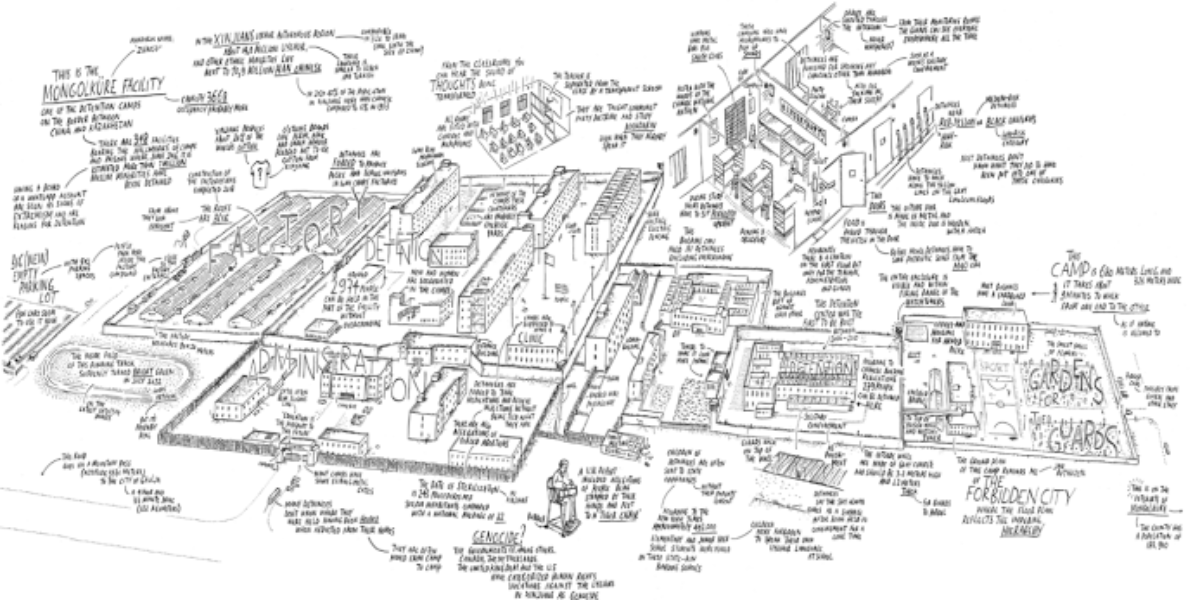
Chinese re-education and punishment camp On the road to Ghulja, a city in China’s Xinjiang autonomous region close to the border with Kazakhstan, lies one of 381 (!) internment camps where mostly Uyghur Muslims are ‘re-educated’. The map shows Camp Mongolkure as the crow flies and was made for the installation ‘Investigating Xinjiang’s Network of…
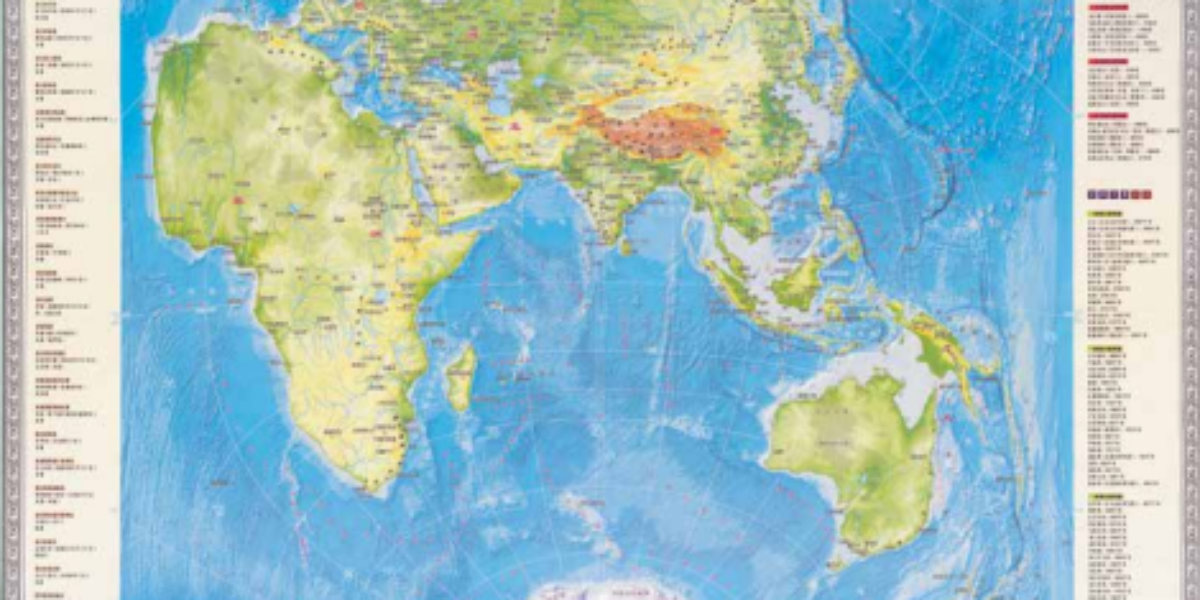
Bipolar Chinese world map This vertical world map puts Europe as an appendage of Asia. North America is upside down and cut off from South America, and Africa is eccentric. Here, the ‘Middle Kingdom’ and the Indian Ocean take centre stage. Indeed, around this is the focus of the ‘Belt and Road Initiative’, the largest…
Coca-Cola conquers the world Boris Artzybasheff is known for his surreal illustrations in popular American magazines. This drawing on the cover of Time Magazine, showing Coca-Cola giving a happy baby globe its bottle, accompanies an article about the marketing strategy this ‘company’ uses to conquer the world. Coke bottlers travelled with the US armies during…

Istanbul and the Bosphorus This rare staff map is, as the colophon states in Ottoman-Turkish, from the Printing Office of the United Chiefs of Staff. Only late in the 19th century did the Ottoman army adopt map techniques from France and Germany, including the standard 1:50,000 scale (1cm on the map is 500m on the…
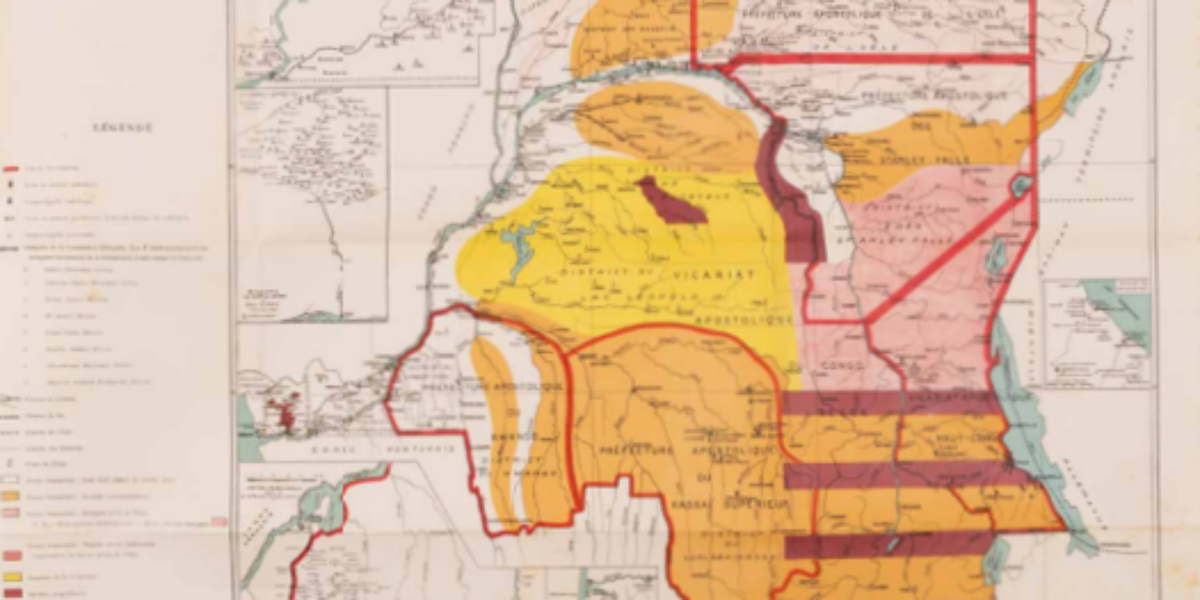
Leopold’s reign of terror in Congo In 1885, the Berlin Conference designated Congo Free State (an area 76 times the size of Belgium!) as the personal possession of King Leopold II. The map uses colours to divide the country into various concession areas. Private companies exploit raw materials here, especially rubber for the transport industry,…
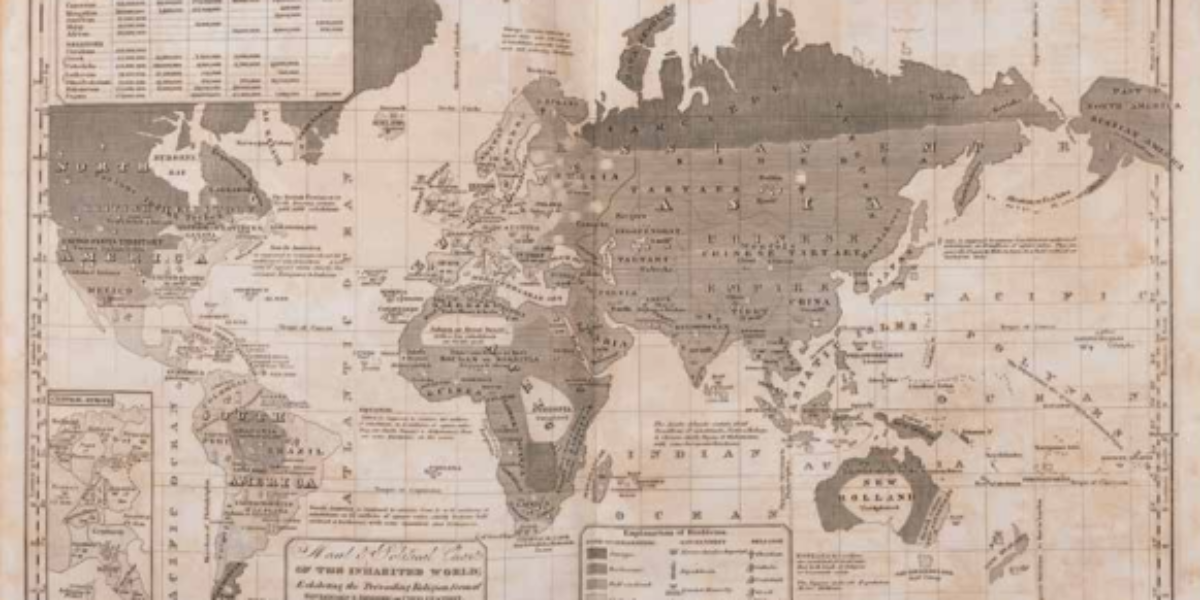
From savages to enlighten This moral and political map is often reprinted from 1821 onwards, including in the School Atlas by Woodbridge and unnamed co-author Emma Willard. Geographically for schoolchildren and the general public, the atlas depicts Western superiority through a modern approach to the process of civilisation. The development from savages, through barbarians, semi-civilised…
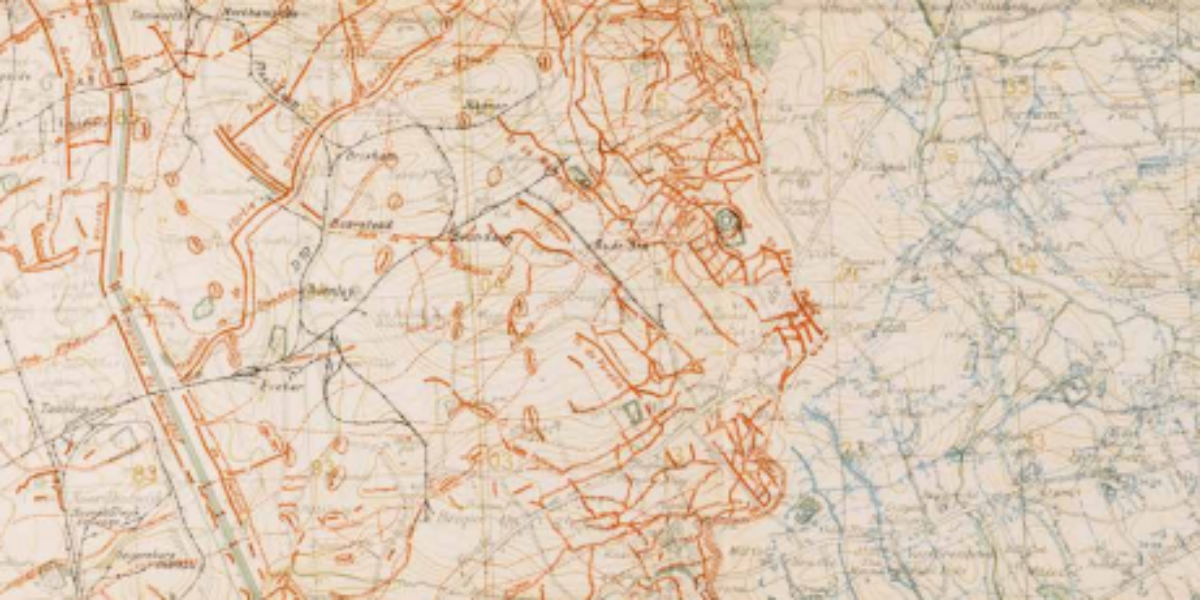
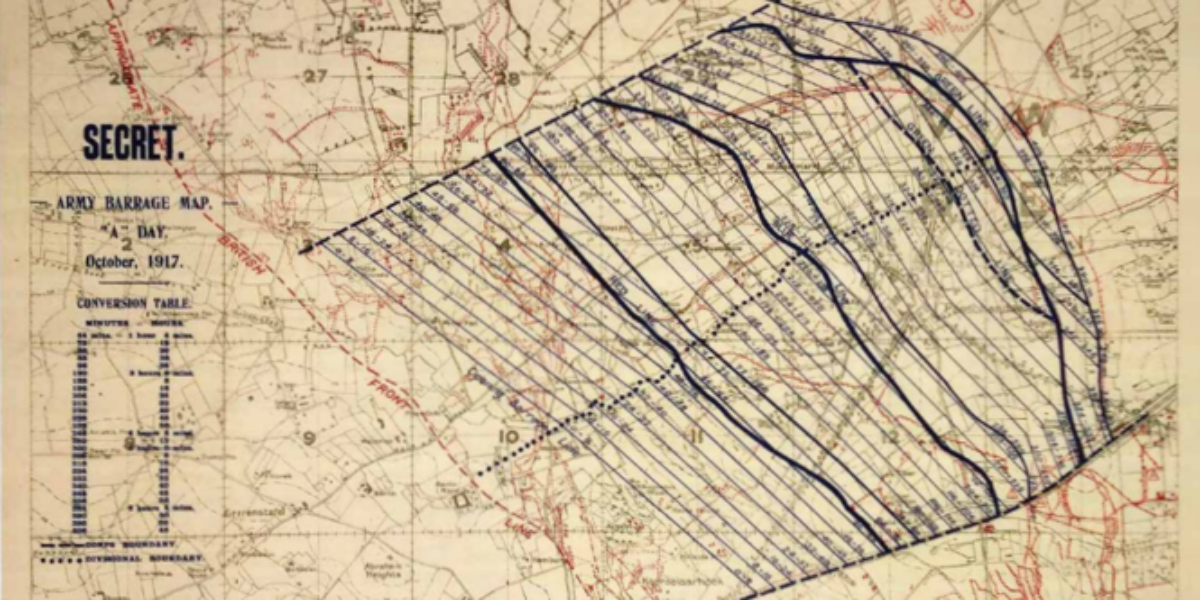
Allied and German trenches This secret map (1:20,000) from September 1918 is overlaid with German (blue) and allied (red) trenches and therefore it may not be used at the front. When Germany cleared fifty Eastern Front divisions after the Russian revolution and rapidly moved them to the Western Front, General Ludendorff managed to conquer large…
Map of Hell at Passchendaele In October 1917, new attacks in the direction of Passchendaele are prepared as Canadian, Australian and New Zealand troops reinforce the British army. The artillery is tasked with to eliminating obstacles and enemy soldiers, while firing over the heads of its own side’s infantry. All the infantry subsequently needs to…
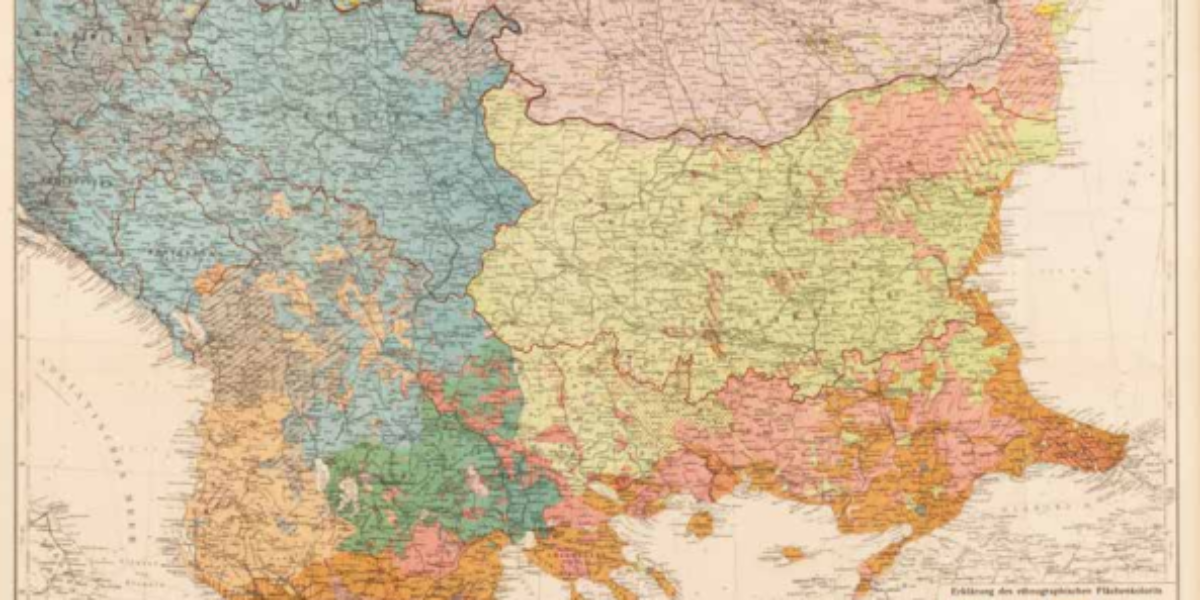
Ethnographic map of the Balkans Ethnographic maps of the Balkans show significant differences, depending on the maker and the country of origin. The choice of relevant language data (mother tongue, school language, church language, market language or official language) depends on the territorial claims that might be legitimized in this way. Especially around Ottoman Macedonia,…
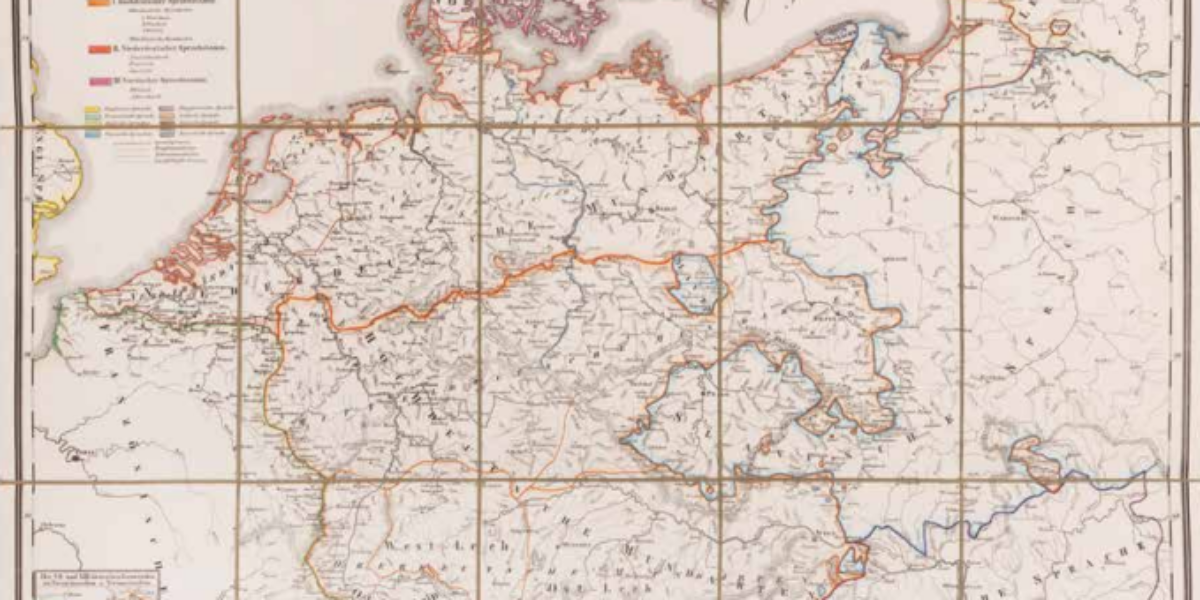
Language map of Germany In 1834, Karl Bernhardi, librarian in Kassel, suggests the creation of a language map of the German nation to national historical societies. In romantic nationalism, a people’s history largely determines the development of their national consciousness, and cultural unity can be seen in a common language more than anything else. After…
Schoolwandkaart van Nederland At the end of the 19th century, the development of lithography makes it possible to print coloured surfaces. On this school map by head teacher C.A.C. Kruyder from Zwolle, the sea is green, and the land is black. The dark, ominous look of this wall map is illuminated to some extent by…
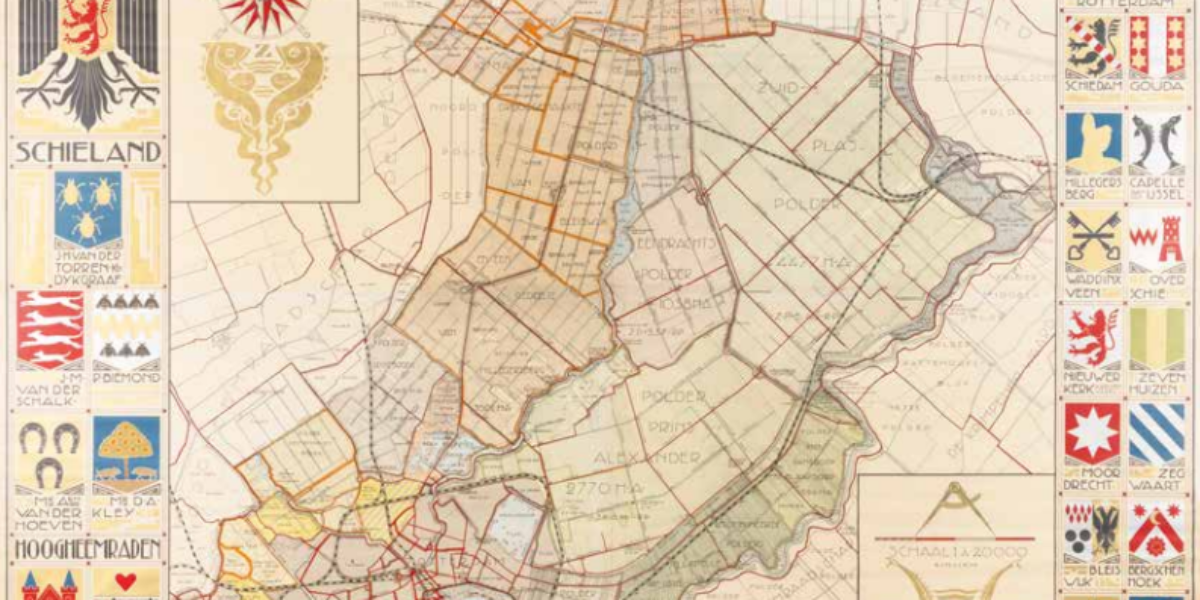
Schieland Water Board This art deco colour lithograph in four sheets celebrates this Water Board’s 650th anniversary. The cover area and surface measurements of the polders are shown on the map, as well as the mills and pumping stations. Note the funny fake family crests on the left.
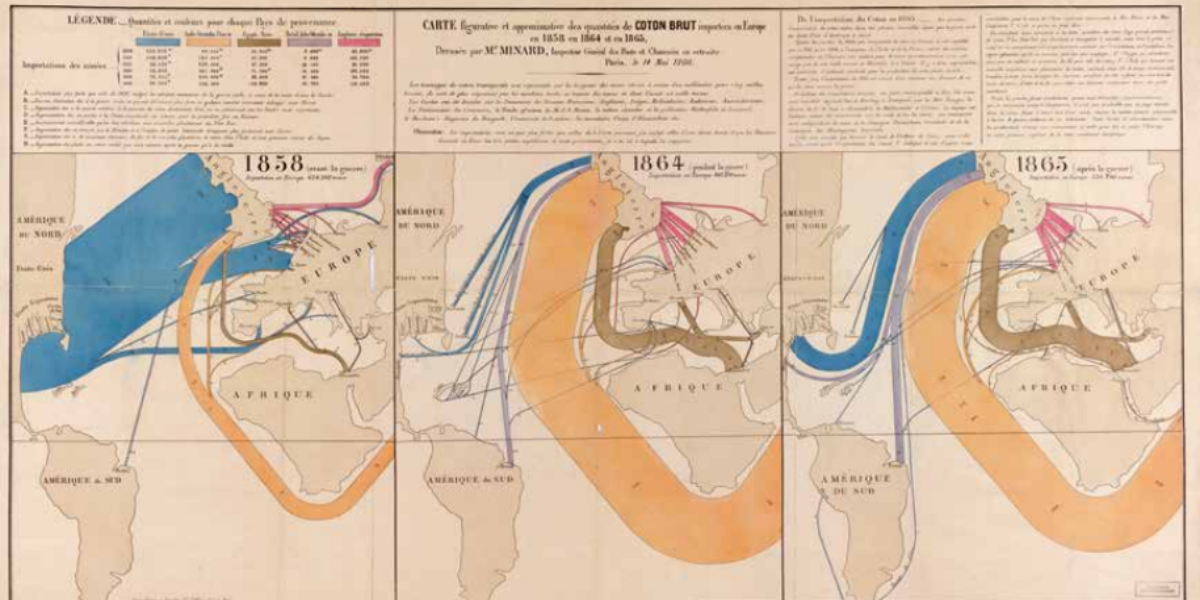
Shifting cotton imports Charles J. Minard is the founder of the infograph, an informative visual representation of spatial and statistical data on a geographical background. On these three infographics showing cotton imports in the years 1858, 1864 and 1865, Minard shows the crisis in the European textile market at the hands of the American Civil…
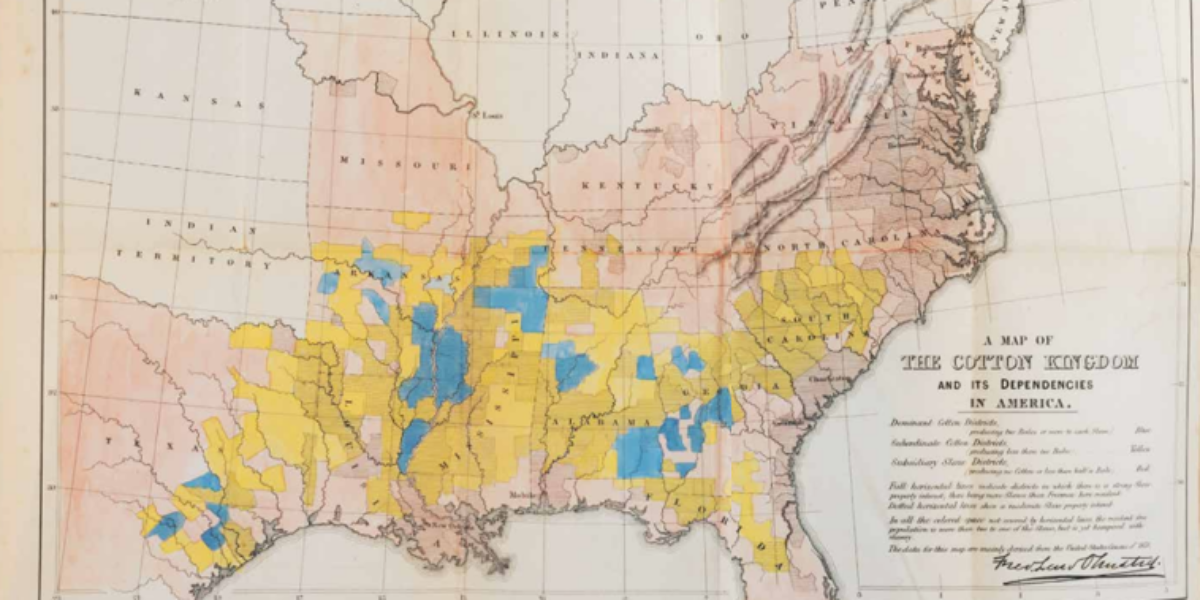
Map of the Cotton Kingdom American landscape architect Frederick Law Olmsted (who also designed New York’s Central Park) travelled the southern United States from 1852 as a journalist. At the beginning of the Civil War, he compiles his reports for the British public in The Cotton Kingdom. He describes the system of slave plantations: a…
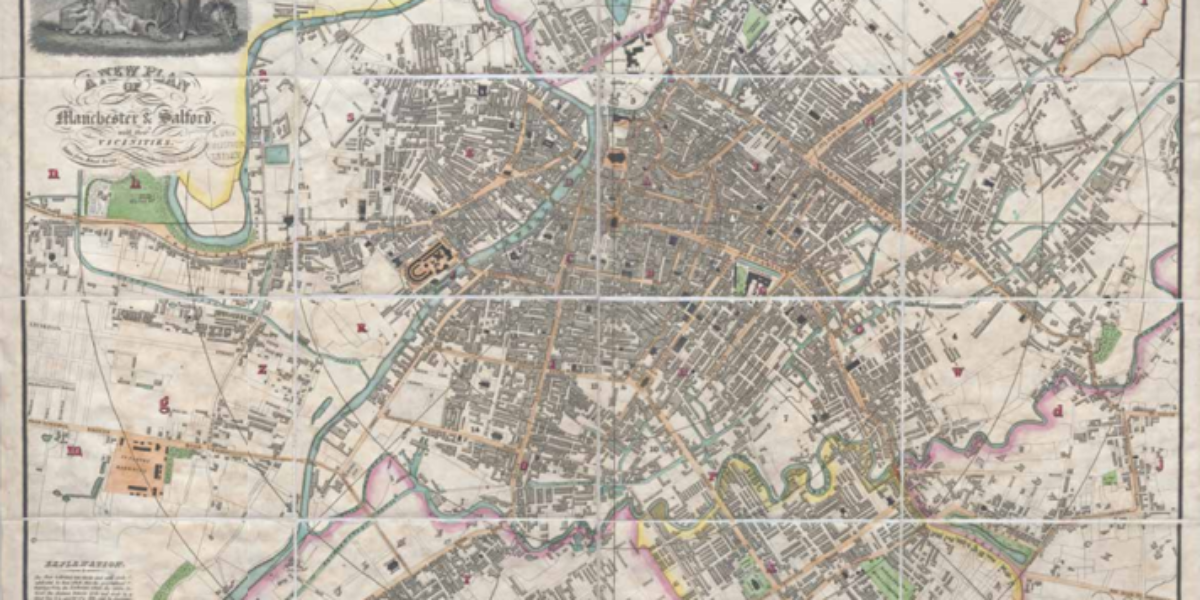
Manchester cotton capital This 1829 map of Manchester is divided into circles, which in turn are divided into smaller sections. The centre is formed by the Textile Exchange, even though it is not at the centre. With alphabetically arranged sectors and a separate list of names, streets can be found quickly on this modern and…
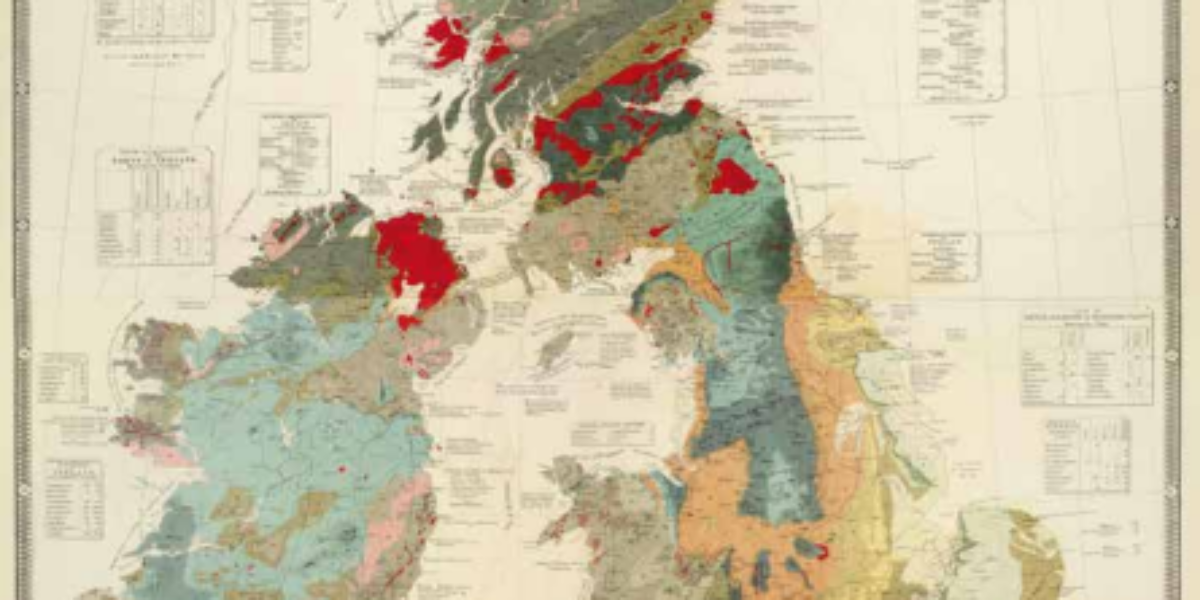
Colour lithograph British Isles Geology and palaeontology are becoming important in locating mineable resources. This colour lithograph of the British Isles reviews the geological knowledge of the area, the formation of rocks and sediments in the Earth’s crust, and fossil remains of organisms below the Earth’s surface.
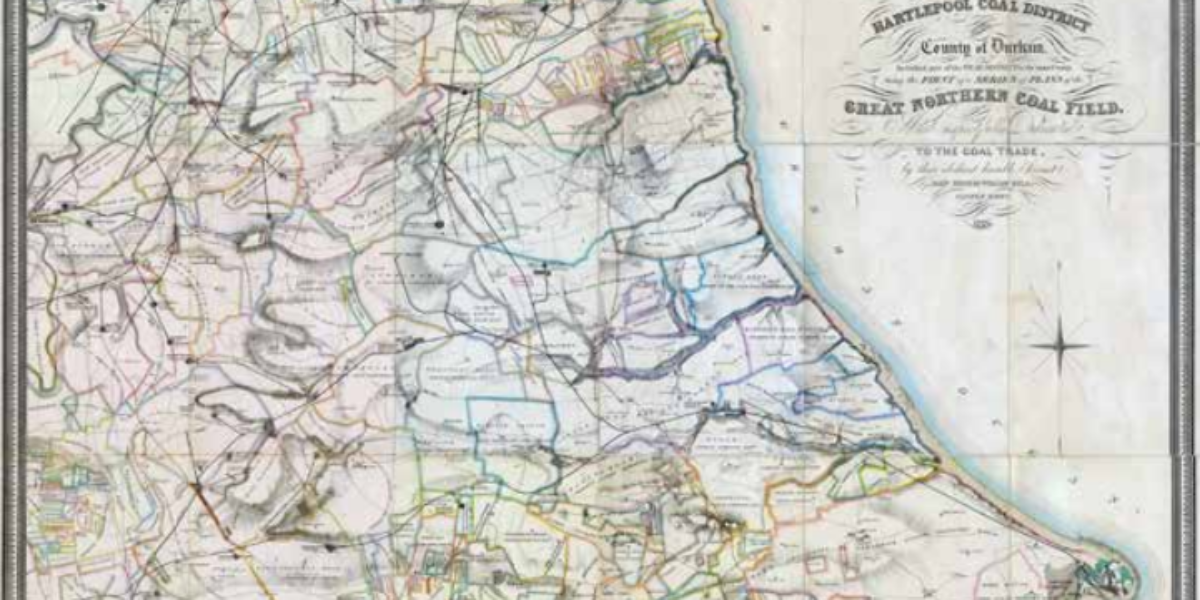
Coal fields of northwest England This map of the fields of the Hartlepool coal district in north-west England provides information on all landowners, the percentages to be paid on mineral yields, and the modern network of mines, railways, and workers’ villages.
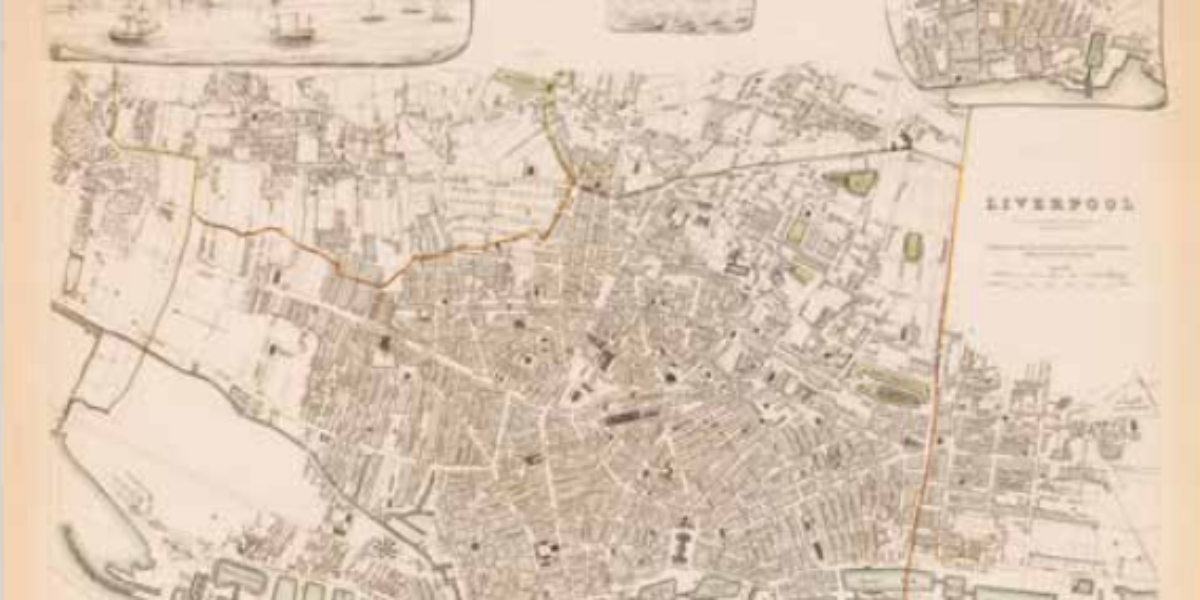
Liverpool map This map of Liverpool aims to promote ‘useful knowledge’. This city with its harbour docks became rich from its leading role in the British slave trade and then from importing raw cotton from slave plantations in the southern United States.
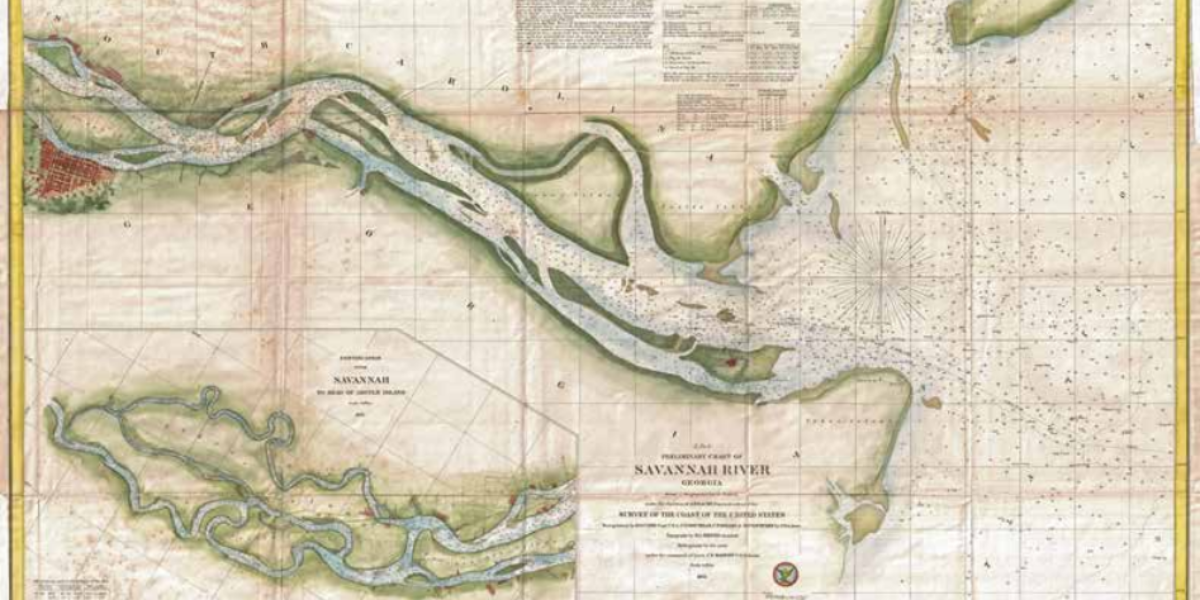
Savannah River, Georgia This modern coastal map shows the Savannah River in Georgia, from its mouth to the city of the same name. Every navigational beacon and buoy are inscribed and the depths of the riverbed are given in fathoms. Savannah was important as a port for the cotton plantations in its hinterland until the…
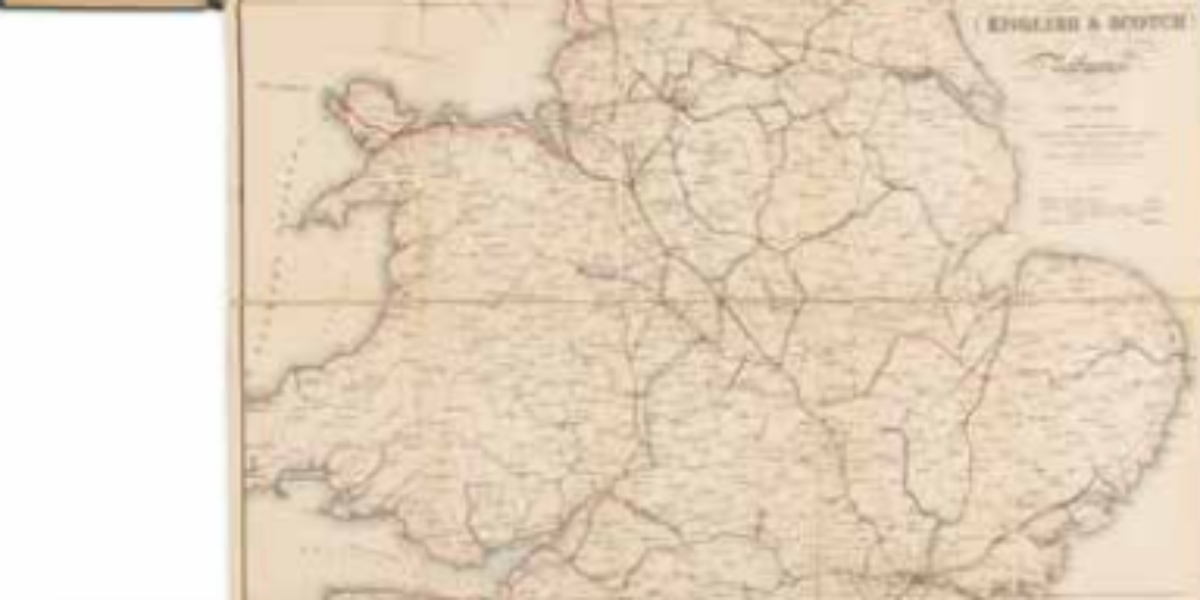
Exponentially growing UK rail network Charles Cheffins’ map shows a nation at full speed by showing existing railway lines in black, indicating lines under construction in red and projecting lines in blue.
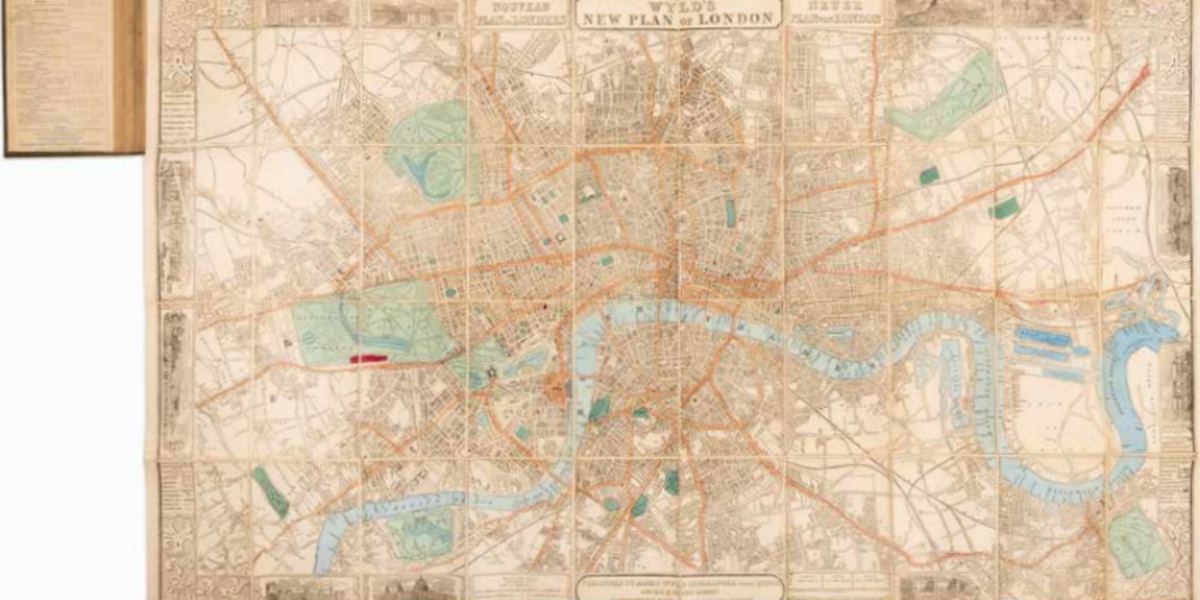
First World’s Fair in London The international nature of the first ‘World Fair,’ with its spectacular shows of leading British industry, is evident from James Wyld’s special map of London: the titles and legend are also in French and German.
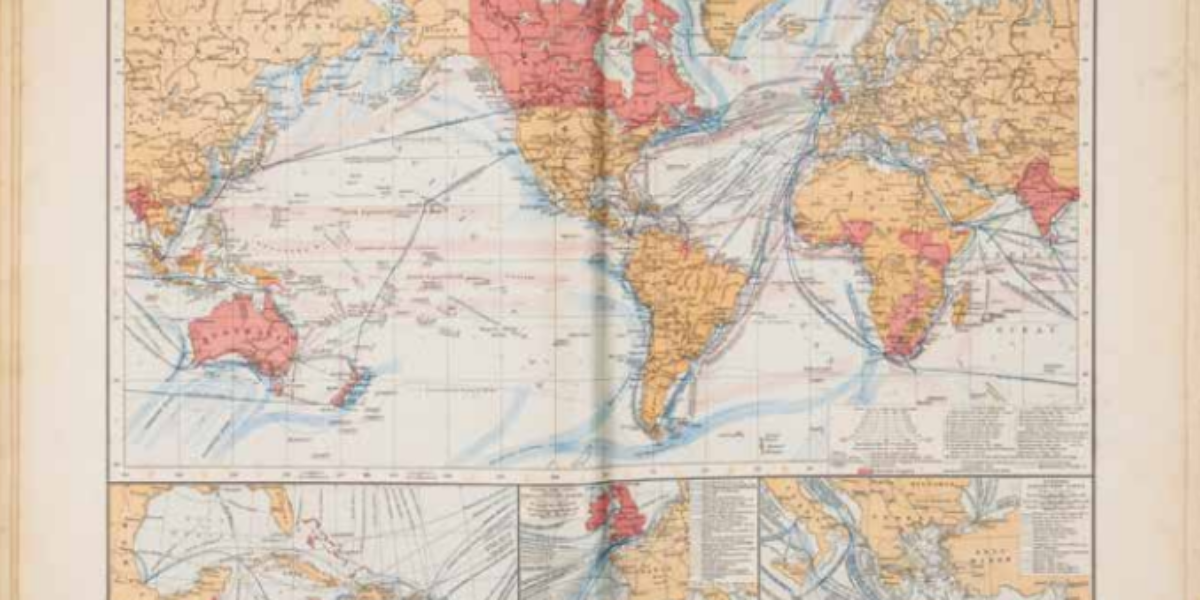
Shipping routes and British Empire This world map in Mercator projection presents the British empire (in red) at the height of its power. Cold gulf streams are blue, warm streams are pink. The map shows the numerous routes of steamships between the larger ports. The three insets name the shipping companies operating regular scheduled services.
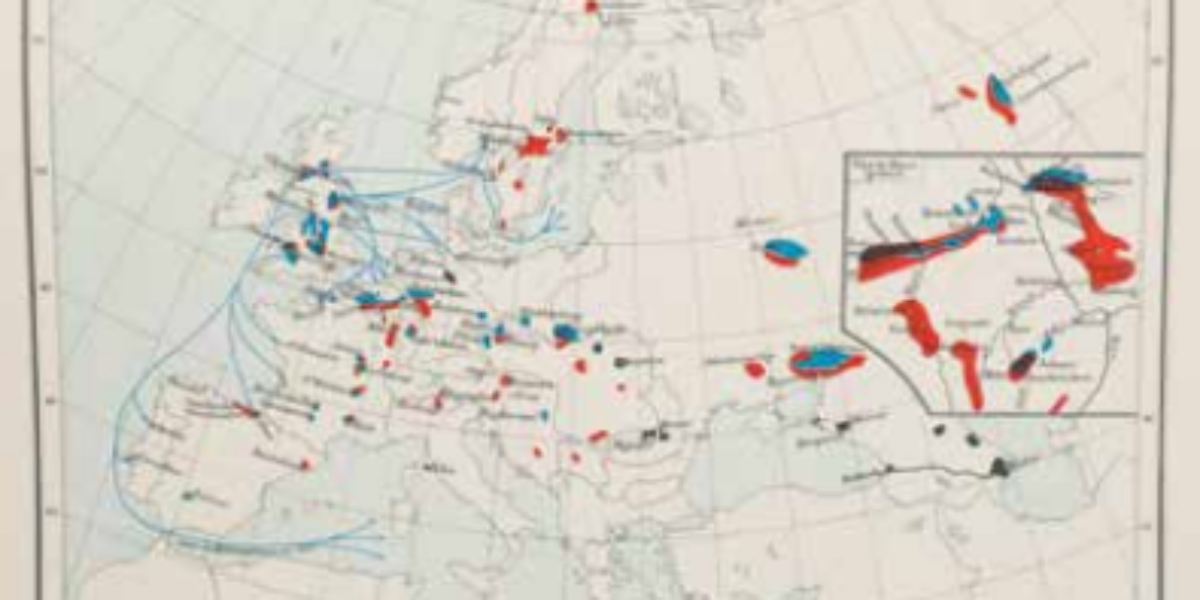
Dutch trade atlas The Hague headmaster J.J. ten Have designs the first Dutch trade atlas. In it, he visualises series of economic data in simple maps. This map shows how during the 19th century the industrial revolution gained a foothold from Wallonia and the Ruhr to Plojesti and the Donbas (the Donets Basin). Ten Have…
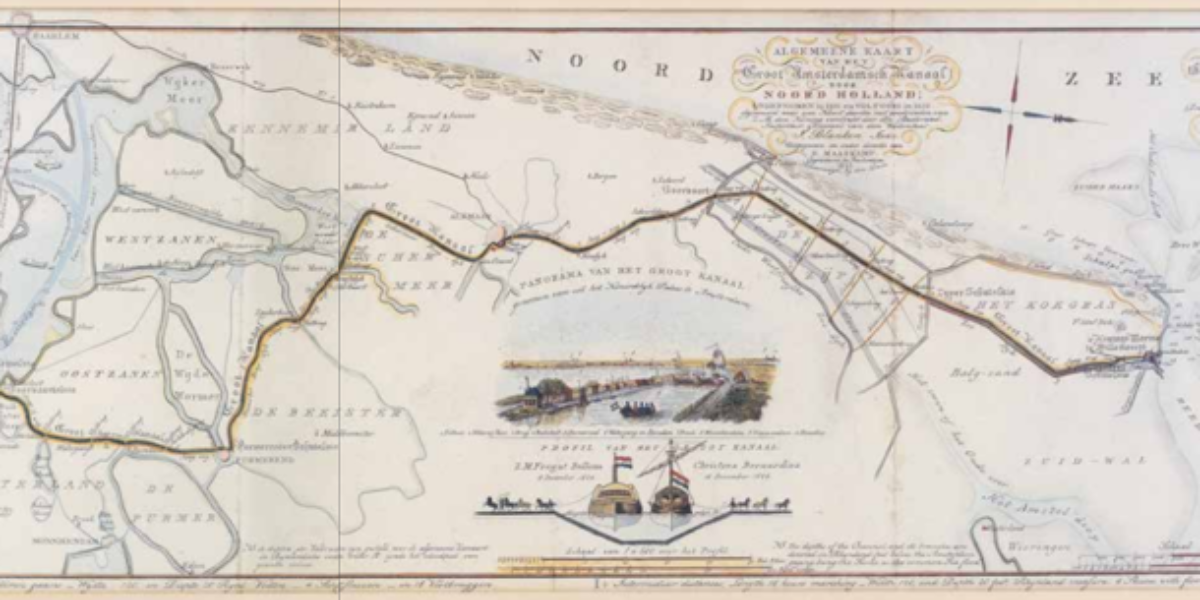
Prestigious North Holland Canal This trilingual survey map of the North Holland Canal celebrates the commissioning of this prestigious project. William I, the ‘canal king’, ordered the digging of this 80 km canal, 37 metres wide and 5.68 metres deep. Horses pull wooden sea ships from Den Helder to Amsterdam within a 24-hour period.
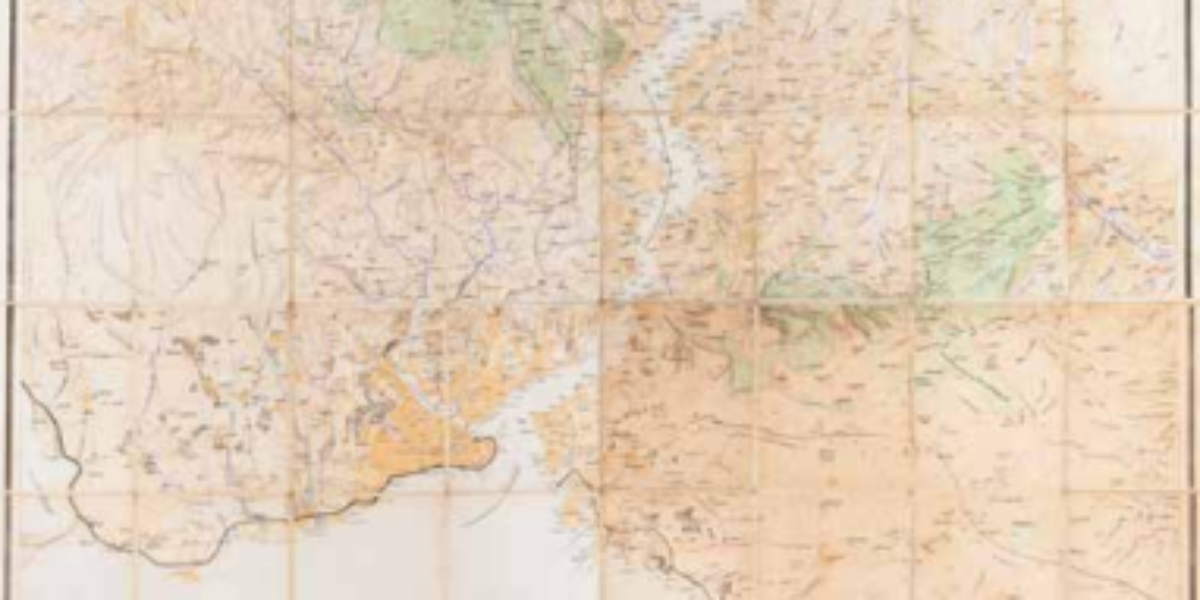
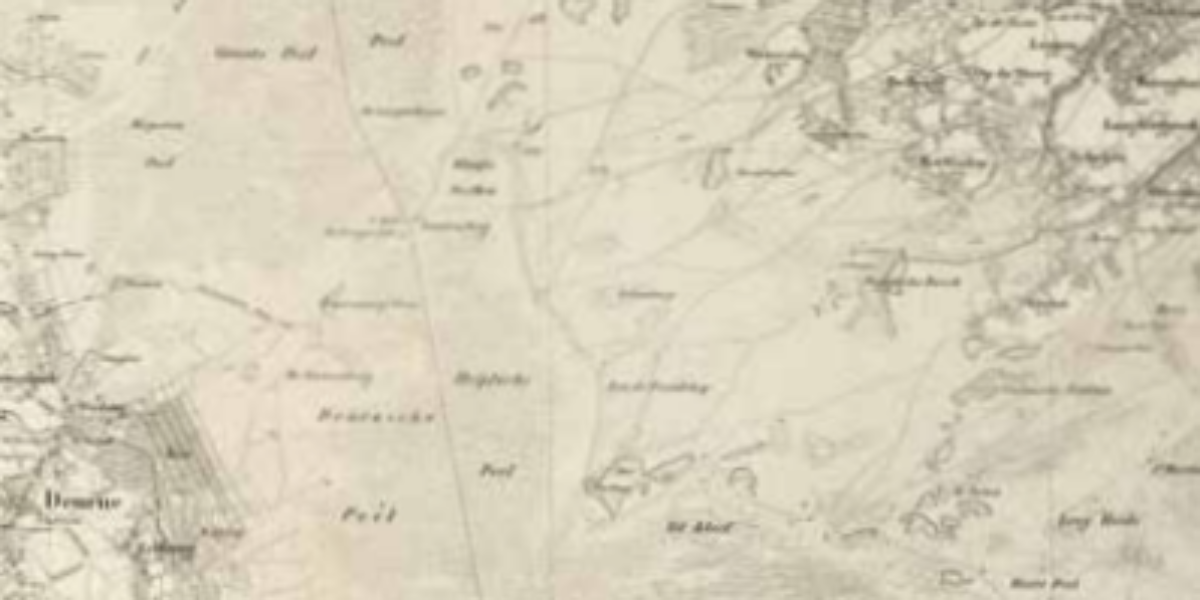
Military-topographical map In 1854, the Peel was still 75 km long and ± 15 km wide; a landscape with heathland, sand dunes, a lot of liquid soil and bog (raised bog), and shallow pools. People started making this ‘onland’ productive by digging canals for drainage and transporting black peat. In 1921, halfway between Deurne and…
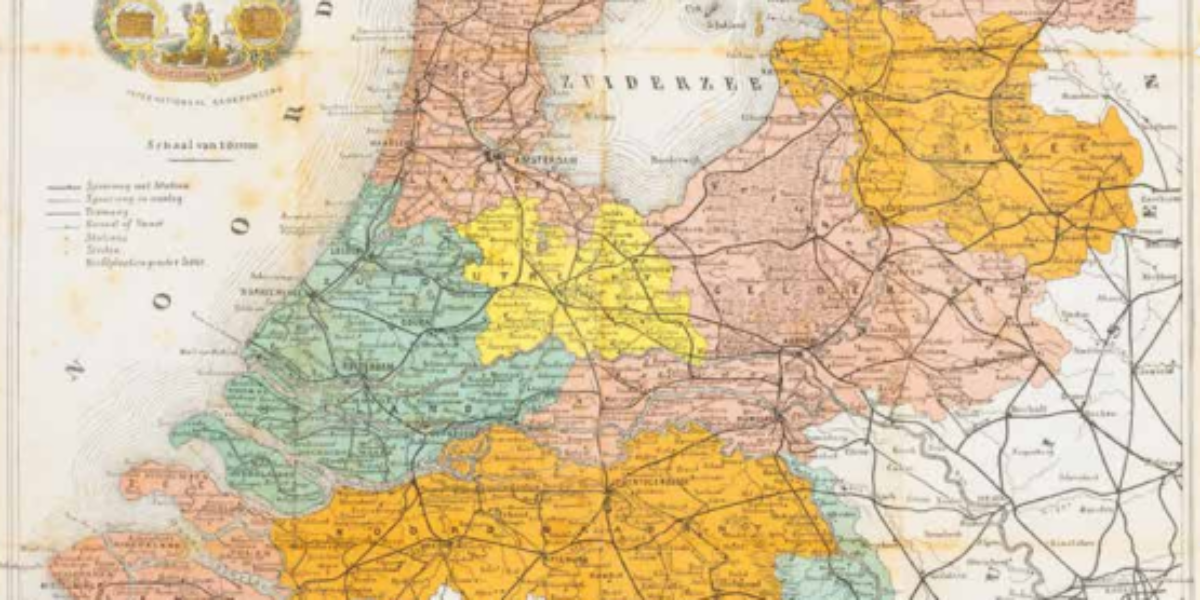
Railway map of the Netherlands This railway map of a cigar factory in Kampen shows the network of railways and tramways of the Netherlands in 1912. Competing companies provide the operations. In 1909, the government introduces a single national time, eliminating confusing timetables with local times.
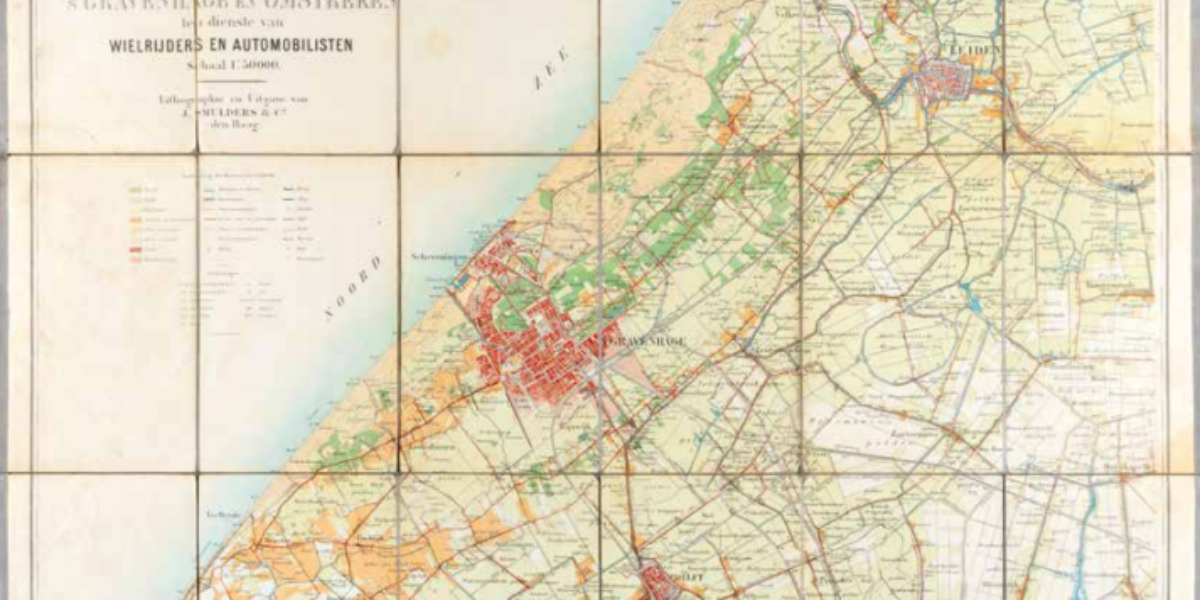
Cyclists and motorists around The Hague After the establishment of the Provincial Water Authority in 1875, the province of South Holland resumes involvement in waterways, rail and tram lines, and gravel and dirt roads, which are also distinguished on this map. The abolition of tolls on the roads stimulates traffic.
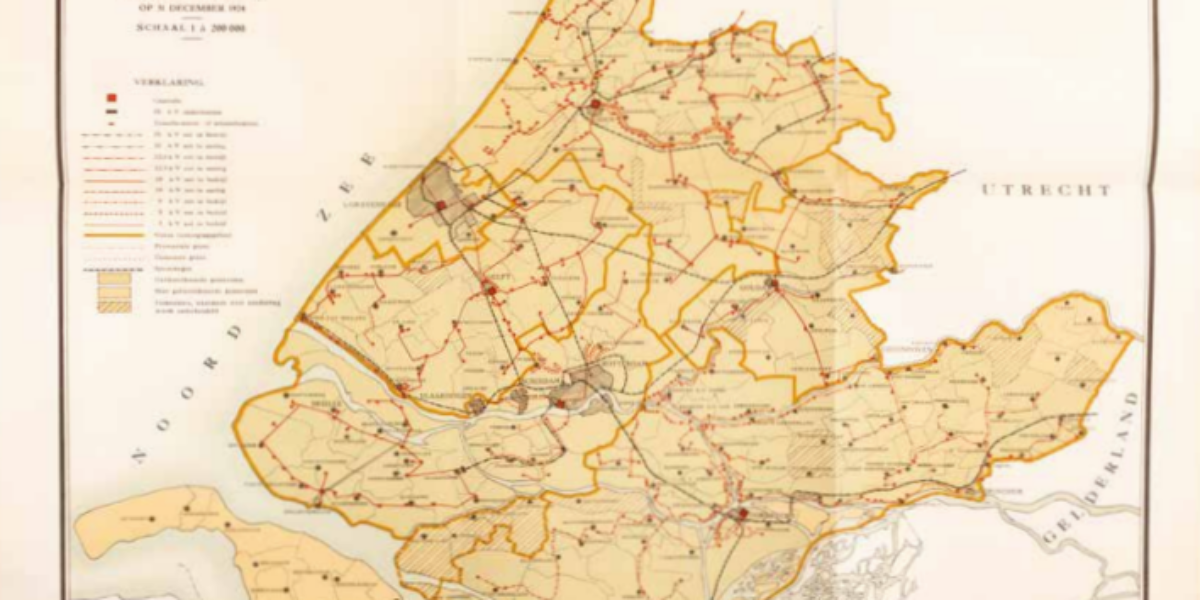
Electrification in South Holland This province map shows electrified and non-electrified municipalities plus those still negotiating for connection. In 1924, the Leiden Light Factory also started supplying cheap electricity for home heating.
Land consolidation in Staphorst From 1924, land consolidation is possible with the consent of the majority of stakeholders. In Staphorst, where farmland of 20 metres wide sometimes stretches as long as five kilometres, this redistribution reduced the number of cadastral plots from 13,000 to 1,900.